Short Report
A Bayesian Look at Funnel Graphs to Detect Publication Bias: A New Model and Application
Stefan Van Dongen*
*Group of Evolutionary Ecology, University of Antwerp, Belgium
Corresponding author
Prof. Dr. Stefan Van Dongen, Group of Evolutionary Ecology, Antwerp University, Groenenborgerlaan 171, B-2020 Antwerp, Belgium, Tel: +32 3 265 33 36; E-mail: Stefan.vandongen@uantwerpen.be
Received Date: 24th August 2015
Accepted Date: 16th November 2015
Published Date: 19th November 2015
Citation
Van Dongen S (2015) A Bayesian Look at Funnel Graphs to Detect Publication Bias: A New Model and Application. Enliven: Biostat Metr 1(1):004.
Copyright
@ 2015 Dr. Stefan Van Dongen. This is an Open Access article published and distributed under the terms of the Creative Commons Attribution License, which permits unrestricted use, distribution and reproduction in any medium, provided the original author and source are credited.
Abstract
Background
Publication bias – when non-significant results (from smaller studies) become underrepresented in the literature - results in an overestimation of average effect sizes. Several statistical methods have been developed to detect and describe publication bias, and to provide adjusted average effect sizes. However, these approaches generally oversimplify reality. Here, a novel Bayesian model is developed which can explicitly model changes in publication bias with covariates leading to a better understanding of the sampling procedure of publication bias, and more realistic adjusted effect sizes. This new approach is applied to simulated data and to empirical data from a recent meta-analysis of associations between fluctuating asymmetry and health and quality in humans.
Results
The Markov Chain Monte Carlo showed rapid convergence. The simulations showed that the new approach detects associations between publication bias and sample size and provides unbiased average effect sizes. The estimated average effect size for the empirical dataset was close to those reported using other methods. The level of publication bias dropped rapidly when sample sizes approached 150 individuals. Posterior predictive checks showed an overall appropriate model fit.
Conclusions
The new model proposed here allows an objective analysis of how the selection process due to publication bias changes with covariates. The exploration of the performance of this new approach indicated advantages over existing methods. It can thus be concluded that the model provides an innovative way to detect and study publication bias and reaches more realistic adjusted effect sizes.
Background
Meta-analyses are widely used to summarize results from different studies. Yet, publication bias - when published studies included in a meta-analysis do not represent all studies on the topic of interest – is expected to cause an upward bias of effect sizes, because statistically significant results may have a higher likelihood of being published [1,2]. While a careful search for unpublished results in a systematic review process is likely to minimize the effects of publication bias, this approach may not always be feasible or successful. Alternatively, different methods to detect and adjust for publication bias are available. Such models should consist of two parts, namely the effect size and the selection process part [2,3]. The former reflects the distribution of the effect sizes in the absence of publication bias, whereas the latter models how this unknown distribution is affected by publication bias [2]. Modeling the selection process may either depend on the effect size estimate and corresponding standard error separately (Copas selection model) or depend on the p-value only (weight functions) [3].
Detecting the presence of publication bias is as such important, but evaluating the importance and impact is even more relevant. While models adjusting for publication bias provide an estimate of average effect size using the model of sampling behavior to correct for the bias, it has often been argued that these adjusted estimates ‘should not be taken too seriously’ [2,4,5]. In line with this view, the aim of this paper is to develop a new approach to model publication bias, primarily extending the capabilities of exploring the selection process. More specifically, the model developed here allows exploring how the selection process changes with sample size (or any other covariate). This aspect has not been incorporated directly in present selection models (see e.g., [1], although sample size does make part of selection models through p-values and/or standard errors), while it is likely that publication bias is stronger in smaller studies. Indeed, if an effect size is not statistically significant in smaller studies, it is more likely due to a lack of statistical power. Consequently, such studies have a higher probability of not being published. Stronger publication bias in smaller studies results in a negative association between effect sizes and sample sizes, which is a popular way to evaluate the presence of publication bias [6,7], and to obtain adjusted average effect sizes (Egger’s regression [8]). It is therefore important to generalize selection models to a two-dimensional selection function depending on both p-values (or effect sizes) and on the underlying study size [2]. Such an approach will be presented here and the estimation procedure is performed in a Bayesian framework. First, the model is formally developed. Second, results are obtained for a set of simulated data. Finally, it is applied to the data from a recent meta-analysis [9].
Results
Model Development
Let us start building the model from a simple random effects linear model and assume that effect sizes ESi (where i = 1 … I, I=number of effect sizes in the meta-analysis from K studies (where K<I)) reflect a sample from an unknown distribution phi (Π) with unknown parameters theta (θ) : ESi~iφ(θ). In the absence of publication bias, it is often assumed that the effect sizes ESi follow a normal distribution with an overall mean of β0 and between-study variation σs2 (the random effects part of the model). If the effect sizes are expressed as correlation coefficients – as will be done in the illustrations below – the residual sampling variation σ2 can be expressed as (1-r2)/(N-2), i.e., the variance of Pearson’s correlation coefficient. Formally, the model can then be written as:
With linear predictor:
And between study variation:
Where k=1 … K, the number of studies. In the absence of publication bias, the effect sizes are expected to follow a normal distribution reflecting the unbiased true distribution of all possible effect sizes. However, if publication bias exists, an excess of statistically significant effect sizes (or a shortage of non-significant outcomes) should emerge. This can be included in the above model by assuming that the effect sizes reflect a sample from a mixture of two distributions, one reflecting an unbiased sample (free of publication bias as in equation 1) and a second which reflects the excess of statistically significant results. The latter can be represented as a truncated normal distribution with lower limit equal to the critical value above which the effect size was statistically significant. The mixture distribution can then be written as:
Where pi is either 0 or 1 assumed to follow a binomial distribution with probability P, i.e., the proportion of excess of effect sizes due to publication bias. Figure 1 provides a graphical display of this model.
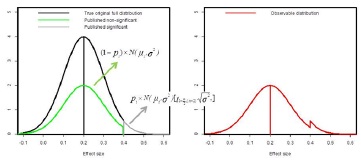
Figure 1 - Graphical representation of the mixture model applied to model publication bias.
The underlying idea is that there is some unknown and unobservable true distribution of effect sizes (which I assume to be normal with mean equal to 0.2 and standard deviation equal to 0.1 in this example) indicated in black in the left panel. The distribution that is observed in the literature is assumed to emerge from all significant effect sizes (i.e., no publication bias, grey) and only a part of non-significant effect sizes (green) due to a smaller likelihood of getting published in the presence of publication bias. The resulting distribution (red on right panel) thus shows an excess of statistically significant results.
An association between the magnitude of publication bias (the proportional excess of statistically significant results) with a covariate (like sample size) can be included by modeling pi as a generalized linear model with logit link and binomial error structure:
And linear predictor:
Where the parameter α1 reflects the association between the level of publication bias and sample size.
Equations 2, 3, 4, 5 and 6 thus harbor the two parts of a model of publication bias. The effect size part is captured in equations 2 and 3, while the selection model part is formulated in equations 5 and 6. Equation 4 links these two parts to the observed distribution of the effect sizes as a mixture of 2 normal distributions, one reflecting the unbiased distribution of effect sizes, and the other accounting for publication bias.
Parameter Estimation in a Bayesian Framework
Having formulated the model, I will proceed by estimating parameters in a Bayesian framework. This requires the determination of prior distributions. For the average effect size (β0)a normal prior distribution with mean equal to zero and variance equal to 106 was used. For the parameters on the logit scale (α0 and α1), a normal prior with mean equal to zero and variance 100 was used, to avoid introducing unwanted strong prior information for large values at the probability scale [10]. The prior distribution of the between-study variance was a truncated normal distribution with mean equal to zero and variance equal to 1000. To avoid numerical problems, the possible values of bk were limited between -0.3 and 0.3 (i.e., study-specific average effect sizes could not deviate more than 0.3 units from the overall average effect size). In addition, sample size was centered, to avoid strong correlations between α0 and α1.Parameter estimates were then obtained using Markov Chain Monte Carlo (MCMC) (see details below).
Assessing Model Fit
In a Bayesian framework, the use of posterior predictive checks has been advocated to explore model adequacy and detecting outliers. The principle is very simple. If a statistical model fits the data relatively well, the model in itself should be able to generate a dataset that corresponds closely with the data. Therefore, during all t-iterations of the MCMC, for each observation in the dataset (ESi) a replicate is generated on the basis of the model parameter values at iteration t as follows:
On the basis of the posterior distribution of the , a model prediction and its 95% C.I. can be estimated. The difference between the model predictions and the observations can then be considered as a measure of model fit or adequacy. Because in this application, I did not intend to compare competing models, I will only present these differences and indicate which observations did not fall within the respective 95% C.I. of the model predictions.
The Simulation Study
Table 1 provides an overview of the results from the analyses of the six simulated datasets. As expected, the weighted average approach overestimated the true underlying effect size in the presence of publication bias. As expected, the selection model approach with monotone weight function did show a strong drop in the weight function for p-values smaller than 0.05 for the constant publication bias scenario (Figure 2). However, the selection model approach appeared to somewhat underestimate the average effect sizes irrespective of the publication bias scenario (Table 1). The Bayesian model presented here, however, provided average effect sizes most closely reflected the underlying average under each condition. In addition, in the datasets where a decrease in publication bias was simulated, a negative slope was indeed observed (Table 1).
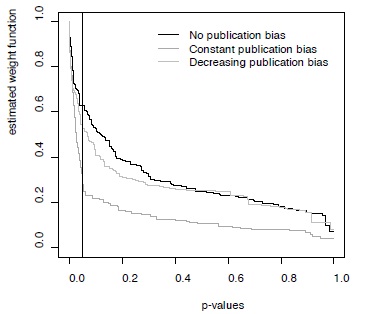
Figure 2 - Weight functions estimated for three simulated datasets with different publication bias scenarios
Weight functions shown here were for the simulations without between-study heterogeneity, but results were very similar for the datasets simulated with between-study heterogeneity (not shown).
|
|
weighted average (SE) |
Rufibach theta (SD) |
Bayesian model |
|||
|
average |
intercept |
slope |
SD |
|||
|
N |
0.154 (0.007) |
0.153 (0.007) |
0.152 (0.009) |
-10.3 (5.89) |
0.036 (0.050) |
0.037 |
|
C |
0.189 (0.006) |
0.104 (0.020) |
0.137 (0.010) |
0.011 (0.22) |
0.011 (0.021) |
0.035 |
|
D |
0.169 (0.007) |
0.120 (0.022) |
0.149 (0.007) |
-5.64 (3.22) |
-0.058 (0.029) |
0.024 |
|
|
||||||
|
N |
0.145 (0.008) |
0.114 (0.050) |
0.143 (0.008) |
-5.42 (1.77) |
0.006 (0.023) |
0.062 |
|
C |
0.207 (0.007) |
0.137 (0.046) |
0.158 (0.009) |
-0.72 (0.36) |
0.005 (0.003) |
0.057 |
|
D |
0.169 (0.007) |
0.116 (0.047) |
0.151 (0.008) |
-6.00 (2.80) |
-0.059 (0.033) |
0.041 |
Table 1 - Overview of parameter estimates from analyses of simulated data
Data were simulated under three different scenario’s of publication bias (N = no publication bias; C = constant publication bias; D = publication bias decreases with sample size). The true underlying effect size equaled 0.15. In addition, two levels of between-study variation in effect sizes were modeled (no variation and standard deviation = 0.05). The six simulated datasets were analyzed using three methods: (i) a weighted average was calculated assuming no publication bias; (ii) the average effect size was estimated assuming publication bias independent of sample size (theta in [2]); and iii) the Bayesian model developed here was modeled, reporting the average effect size, the parameter estimates modeling the mixture distribution (equation 6) and the degree of between-study variation in effect sizes.
The Analysis of an Example Dataset
As reported previously [9], there was a highly significant negative correlation between effect size and sample size (Spearman rank correlation = -0.34, p<0.0001, Figure 3 left panel) in this dataset. In addition, one can discern a cluster of effects just exceeding the threshold significant effect at the low end of sample size, indicating higher levels of publication bias in smaller studies [9]. Indeed, standardized effect sizes showed a bimodal distribution corresponding with a mixture of a normal and a truncated normal distribution (Figure 3 right panel).
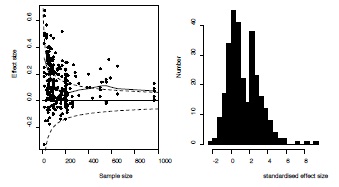
Figure 3 - Graphical exploration of the presence of publication bias in the example dataset.
Left: Funnel graph of the 293 effect sizes of association between fluctuating asymmetry and measures of health and quality in humans. Critical values above or below which the effect sizes are statistically significant are provided as dashed lines. The association between effect size and sample size is given using a lowess smoothing. Right panel: Distribution of standardized effect sizes showing a bimodal pattern reflecting a mixture between a normal and truncated normal distribution (see text for details).
Results from the Bayesian model developed in this paper can be summarized as follows. The average overall effect size equaled 0.116 (SE=0.013) with 95% credibility interval ranging between 0.092 and 0.143. There was thus a robust overall association between fluctuating asymmetry and measures of health and quality in humans. The association between the degree of excess of statistically significant effect sizes and sample sizes (log-transformed) was negative, with an intercept of 2.82 (SE=1.61; 95% credibility interval: -0.30 – 6.08) and slope of -1.00 (SE=0.38; 95% credibility interval: -1.80 – -0.29). The between-study variation in effect sizes equaled 0.009 (SE=0.003; 95% credibility interval: 0.005 – 0.015). The estimated mixture distribution showed that the excess of significant effect sizes was mainly present for the smaller effect sizes (darker grey shading above critical value and more observations just above this threshold level, Figure 4). The negative association between the sample size and the level of publication bias – i.e., an excess of significant effect sizes – is provided in Figure 5 together with the effect size specific probabilities of belonging to the truncated normal distribution. Degree of publication bias dropped rapidly with sample size, yet, still some effect sizes showed some degree of likelihood of being associated with the truncated normal distribution. The distribution of the random effects followed a normal distribution and ranged between -0.15 and 0.15 (Figure 6). Thus, constraining the range of the random effects between -0.3 and 0.3 to avoid numerical problems did not influence the results. Finally, for only 9 (3.1%) out of the 293 observations (and thus slightly less than the 5% expected just by chance), the observed effect size fell outside of the 95% C.I. of the replicate observations (Figure 7). Thus, overall the model appeared to adequately fit the observations.
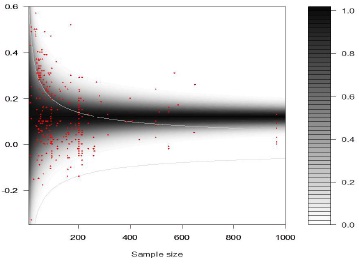
Figure 4 - Funnel graph with mixture distribution.
Contour-plot of estimated mixture distribution (grey shading) and observed effect sizes (red dots). Light grey lines represent the critical values above and below which effect sizes were statistically significant. The average overall effect size equaled 0.116 (see text for details).
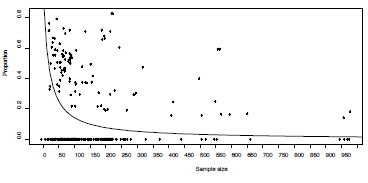
Figure 5 - Estimated association between the degrees of publication bias – expressed as proportional excess of statistically significant results – and sample sizes.
Posterior means of effect-size specific probabilities are indicated as dots.
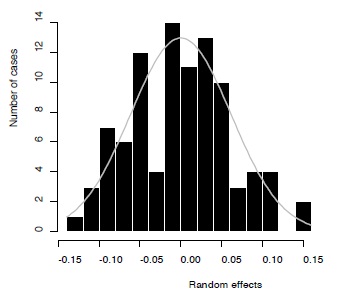
Figure 6 - Distribution of the random effects (black bars) and the expected normal curve (grey).
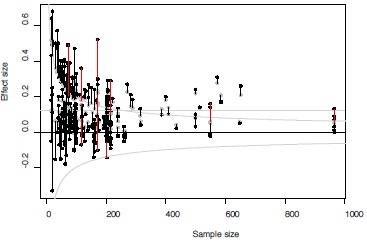
Figure 7 - Exploration of model fit.
Funnel graph of observed effect sizes (black) and posterior means of model estimates (gray). Lines connect the observed effect sizes and their respective model estimates. Lines in red indicate observed effect sizes that fell outside the 95% C.I. of their model estimates (i.e., indicating poor model fit, see text for details).
Discussion
As publication bias can hamper the interpretation of systematic reviews [1], there is a need for a better understanding of the selection process which affects the likelihood of a study being published or not. While several methods have been proposed to model and adjust for publication bias, they can be broadly grouped in different categories. Indirect methods make use of the available data, and apply some statistical model to ‘account for’ the effects of publication bias, while, direct methods obtain missing estimates, by actively searching for unpublished results. While the latter is probably the only correct method to obtain ‘adjusted’ estimates of effect sizes eliminating the effects of publication bias, it may often be difficult to retrieve all unpublished results. Not all researchers may be willing to share unpublished results or may not be able to retrieve them (e.g., data on an old computer that crashed, or when the study was done by co-workers who left the field). Therefore, indirect methods have received a lot of attention to model the selection process and obtain adjusted effect sizes. However, the current view is that these models are useful to explore the selection function, but that adjusted effect sizes are of secondary importance. Nevertheless, when models become more realistic, it can be anticipated that adjusted effect sizes will be closer to the true value. It is therefore important to develop more realistic models. One aspect that has not previously been incorporated is that the level of publication bias may change with sample size (or other covariates) [2].
In this paper, a new model is proposed and implemented in a Bayesian framework. The model contains elements from other approaches, and has the additional possibilities to incorporate between-study variation in effect sizes and to study changes in the selection function with covariates. It makes use of a truncated normal distribution to represent the publication bias (see also [11,12]). In contrast to previous applications, the truncation parameter is based on the critical value above which effects sizes are statistically significant. In this way, the selection function is based on both the effect size and its standard error, as in Copa’s selection models, and also on p-values, as in selection models with weight functions [2]. Since the publication bias process is modeled here as a mixture of two normal distributions, one reflecting the true distribution of effect sizes, the other the excess of significant results, it is possible to implement a function by which this proportion of excess changes with a covariate. This creates a two dimensional selection function where the likelihood of an effect size getting published depends on both the statistical significance and (for example) sample size. In the application of the model here, a logistic regression model was implemented to study changes in publication bias with sample size, but alternatives could be implemented.
A small simulation study performed above indicated that the Bayesian model i) is capable of detecting changes in the magnitude of publication bias with sample size, ii) the estimated average effect sizes were close to the expected true value, and iii) the estimation of the average effect sizes was robust against misspecifying the publication bias model. In contrast, the selection model approach recently developed [2] appeared to somewhat underestimate the true average effect size, yet did indicate the expected sharp drop in the weight function for p-values below 0.05. While the simulation study provided here is too limited to weigh the advantages and disadvantages of selection models and the mixture approach, it does indicate that the Bayesian mixture model is likely to perform well for meta-analyses of the magnitude of the empirical dataset analyzed here as well.
In applying this new model to this recent meta-analysis [9], it was possible to explicitly explore the change of degree of publication bias with sample size. The Bayesian model showed a sharp decrease in degree of publication bias with very low levels for sample sizes above 150 to 200. Nevertheless, a few effect sizes did show some evidence of being members of the truncated normal distribution, suggesting that the level of publication bias does not disappear completely. The average effect size, albeit of limited interest here, was within the range of proposed values by [9]. This could indicate that different approaches are quite robust in providing an adjusted effect size, but could also be seen as an indication that such adjusted effect sizes are not particularly meaningful. Clearly, a further comparison of results from different models of publication bias to a series of meta-analyses will be useful to increase our understanding of the value of these techniques. Nevertheless, the new Bayesian model appears capable of expanding the assessment of the relationship between publication bias and effect size by the inclusion of other variables.
Conclusions
As publication bias is an inherent problem to many meta-analyses, the exploration of the selection process leading to the biased published literature is crucial to put the outcome of the systematic literature review in the right perspective. The new model and statistical approach presented here is shown to be very suitable to gain better insights in the origins of the publication bias process and to obtain better adjusted effect sizes.
Methods
Simulation Study
The performance of the model developed here will be explored analyzing six simulated datasets. In each simulation, 250 studies were simulated, with sample sizes sampled from a half-normal distribution with a mean of 100 and standard deviation of 70. The average effect size equaled 0.15 in all cases. Three scenarios of publication biases were simulated. No publication bias, a constant degree of publication bias and a decreasing level of publication bias with sample size. For the scenario with constant publication bias, the probability for a non-significant result to enter the dataset was only half of that of significant results irrespective of the sample size. For the scenario where publication bias decreased with sample size, the probability for a non-significant to enter the dataset was assumed to increase with sample size by a generalized linear model with an intercept of -5 and slope of 0.1. This results in an increasing overrepresentation of statistically significant effect sizes as sample size decreases. The probability for a non-significant result to be published when sample sizes are below 20 was nearly zero in this simulation. This probability reaches about 50% for sample sizes around 50, and becomes nearly 100% for studies with sample sizes above 100. The level of publication bias was thus nearly 100% when sample sizes were 20 or lower and gradually disappeared towards sample sizes of 100 and higher. Each of these three scenario’s was simulated assuming either no or with between-study variation in effect sizes (σs=0 "or" 0.05). For each of these six simulated datasets, average effect sizes were estimated using a weighted average (i.e., assuming no publication bias), a selection model with monotone weight function (i.e., assuming constant levels of publication bias, [2]), and the Bayesian model developed in this paper (i.e., assuming a decreasing level of publication bias with sample size). Performances of each method will be compared.
Example Dataset
Finally, I apply this model to an empirical dataset, reanalyzing the meta-analysis of the associations between fluctuating asymmetry and measures of health and quality in humans [9]. This dataset consists of 293 effect sizes from 94 studies (the ‘full sample’, see online supporting material in [9] for the raw data). Van Dongen and Gangestad [9] already reported potential problems of publications bias and attempted to adjust average effect sizes using different approaches. The uncorrected average effect sizes equaled 0.18, while the corrected estimates ranged between 0.07 and 0.12. In one of the analyses, Van Dongen and Gangestad [9] somewhat arbitrarily – and based on visual inspection of the funnel graph – decided that publication bias would be absent or relatively unimportant for studies with sample sizes above 150. The Bayesian model presented here will not only present an adjusted estimate of the overall effect sizes (which is not of primary interest, see above), but more importantly, allows investigating the extent of publication bias and how it changes with sample size.
In a first exploration of the data, a funnel graph (see also [9]) and a histogram of standardized effect sizes will be plotted to visually inspect the possibility of publication bias and thus the presence of a mixture of a normal and truncated normal distribution. Next, the above model was fitted to this dataset in a Bayesian framework in the software package Open BUGS version 3.2.1. (Freely available at: http://www.openbugs.info/w/). As the distribution of the sample sizes was highly skewed (skewness = 2.90), sample sizes in formula (6) were replaced by their natural logarithm. Five independent Markov Chain Monte Carlo chains were run, with a burn in of 1000 iterations, and subsequent 5000 iterations to approximate the posterior distributions. Convergence was reached rapidly (details not shown), and the whole estimation procedure took less than 5 minutes on a 64 bit laptop. Posterior distributions of the model parameters will be summarized by the mean, standard deviation and 95% credibility intervals of the 25000 iterations. To assess model fit, a graphical exploration of the mixture distribution, the distribution of the random effects and the association between effect size specific probabilities pi and sample sizes will be performed. In addition, posterior predictive checks were explored graphically.
References
- Mavridis D, Sutton A, Cipriani A, Salanti G (2013) A fully Bayesian application of the Copas selection model for publication bias extended to network meta-analysis. Stat Med32: 51-66.
- Rufibach K (2011) Selection models with monotone weight functions in meta-analysis. Biom J 53: 698-704.
- Hedges LV, Vevea J (2005) Selection method approaches. In Publication bias in meta-analysis (eds. Rothstein H, Sutton AJ, Borenstein M) John Wiley and Sons Ltd., Chichester, 9: 145-174.
- Hedges LV (1988) Comment to the article ‘selection models and the file drawer problem’. Statistical science 3: 118-120.
- Light RJ, Pillemer DB (1984) Summing up: The Science of Reviewing Research. Cambridge, Massachusetts: Harvard University Press.
- Dear KB, Begg CB (1992) An approach for assessing publication bias prior to performing a meta-analysis. Stat Sci 7: 237-245.
- Palmer AR (2000) Quasireplication and the contract of error: lessons from sex ratios, heritabilities and fluctuating asymmetry. Ann Rev Ecol Sys 31: 441-480.
- Egger M, Smith GD, Schneider M, Minder C (1997) Bias in meta-analysis detected by a simple, graphical test. BMJ 315: 629-634.
- Van Dongen S, Gangestad SW (2011) Human fluctuating asymmetry in relation to health and quality: a meta-analysis. Evol Hum Behav 32: 380-398.
- Van Dongen S (2006) Prior specification in Bayesian statistics: three cautionary tales. J Theor Biol 242: 90-100.
- Formann AK (2008) Estimating the proportion of studies missing for meta-analysis due to publication bias. Contemp Clin Trials 29: 732-739.
- Van Dongen S (2012) Are smarter people (a bit) more symmetrical? A matter of how to adjust for publication bias? J Neg Res Ecol Evol Biol 9: 1-14.