Research Article
SNPs of ASPM Suggested Population Differentiation and Genographic Patterns among Diverse Population
Madhuri Haque1, Sudarshan Chatterjee1, Md. Shaifur Rahman2*, Hossen M. Jamil2, Naznin Akhtar2, SM Abdul-Awal3, and Sikder M. Asaduzzaman2*
1Department of Biotechnology and Genetic Engineering, Jahangirnagar University, Dhaka, Bangladesh
2Tissue Banking and Biomaterial Research Unit, Atomic Energy Research Establishment, Dhaka, Bangladesh
3Signal Transduction Group, University of Cambridge, Downing Street, Cambridge CB2 3EA, UK
Corresponding author
Md. Shaifur Rahman, Tissue Banking and Biomaterial Research Unit, Atomic Energy Research Establishment, Dhaka 1349, Bangladesh, Tel: +8801714476311; Fax: 88027790034; E-mail: mdshaifur@gmail.com
Received Date: 30th April 2016
Accepted Date: 08th June 2016
Published Date: 15th June 2016
Citation
Haque M, Chatterjee S, Rahman MS, Jamil HM, Akhtar N, et al. (2016) SNPs of ASPM Suggested Population Differentiation and Genographic Patterns among Diverse Population. Enliven: J Genet Mol Cell Biol 3(1): 001.
Copyright
@ 2016 Dr. Md. Shaifur Rahman. This is an Open Access article published and distributed under the terms of the Creative Commons Attribution License, that permits unrestricted use, distribution and reprodu
Abstract
Background
Signatures of positive selection in ASPM across human lineage suggest a rich pool of genetic variation. SNPs are one of the most common types of genetic variations and essential for deeper understanding of population differentiation.
Subjects and Methods
Taking the advantages of 1000 genome project data, we extensively analyzed a population based SNPs of ASPM gene among geographically distinct populations for understanding genographic similarities and differences using various methods of population genetics and statistics.
Results
Analysis of the common (MAF>0.05) SNPs among four major population (AF, EA, SA and EU) comprised of sixteen subpopulation from 1000 Genomes data showed different pattern of variation in ASPM gene. We also found population specific SNPs significantly present in one population with a MAF greater than 0.05 and absent in other suggesting that ASPM is possibly under selection resulting variations among populations. Fst detected lowest distance between SA and EU with a mean value of 0.014534, whereas EA and EU measured an estimated mean Fst of 0.12402. Surprisingly, the HWE test resulted five significant SNPs (rs6700180, rs10922163, rs10801589, rs10754216, rs3737111) shared among SA and EU with similar p-value (<0.05). The Tajima’s D test showed mid-region of ASPM with significant value especially from 197070 kbp to 197090 kbp suggesting enriched region with possible selective pressure. Venn analysis identified that 11 SNPs were shared in all the population. AF population acquired 135 variations that are specific to them. In African YRI subpopulation 45 SNPs found to be specific, and in EU subpopulations 48 SNPs were shared by TSI, FIN and IBS but not GBR.
Conclusions
Our results were found to be coherent with the presently accepted out of Africa theory that the geographic origin and early migration of modern humans which argues that every living human being is descended from a small group in Africa, who then dispersed and migrated into the wider world through multiple waves. Finally, we proposed a genographic tree of these populations and comment on possible future study directions.
Keywords:
ASPM; 1000 Genome project; SNPs; Population differentiation; Genographic tree
Abstract
Abstract
Background:
Signatures of positive selection in ASPM across human lineage suggest a rich pool of genetic variation. SNPs are one of the most common types of genetic variations and essential for deeper understanding of population differentiation.
Subjects and Methods:
Taking the advantages of 1000 genome project data, we extensively analyzed a population based SNPs of ASPM gene among geographically distinct populations for understanding genographic similarities and differences using various methods of population genetics and statistics.
Results
Analysis of the common (MAF>0.05) SNPs among four major population (AF, EA, SA and EU) comprised of sixteen subpopulation from 1000 Genomes data showed different pattern of variation in ASPM gene. We also found population specific SNPs significantly present in one population with a MAF greater than 0.05 and absent in other suggesting that ASPM is possibly under selection resulting variations among populations. Fst detected lowest distance between SA and EU with a mean value of 0.014534, whereas EA and EU measured an estimated mean Fst of 0.12402. Surprisingly, the HWE test resulted five significant SNPs (rs6700180, rs10922163, rs10801589, rs10754216, rs3737111) shared among SA and EU with similar p-value (<0.05). The Tajima’s D test showed mid-region of ASPM with significant value especially from 197070 kbp to 197090 kbp suggesting enriched region with possible selective pressure. Venn analysis identified that 11 SNPs were shared in all the population. AF population acquired 135 variations that are specific to them. In African YRI subpopulation 45 SNPs found to be specific, and in EU subpopulations 48 SNPs were shared by TSI,
Public Summary
Homo sapiens evolved with distinct capabilities which made them the most successful species to reach and survive at every furthest corner of the world. Though there are vast differences in culture, language, complexion, and geographical location among population, all share close similarity in the genome. However, there are differences in single nucleotide level that called SNP variation or Single Nucleotide Polymorphism. Two genes (ASPM and FOXP2) are thought to be related with brain size and lexical tone. Taking the advantages of 1000 Genome Project data, we extensively analyzed the SNPs of ASPM gene among geographically distinct populations for understanding similarities and differences using various methods of population genetics and statistics. We found signatures of population differentiation and varied degree of selective pressure that has made them unique. European population was found sharing close similarity with South Asians but African is distantly related. Our results were found to be coherent with the out of Africa theory that human being is descended from a small group in Africa, who then dispersed and migrated into the wider world.
Introduction
In last 3-4 million years hominid evolution has been ongoing and prominent, especially the brain size has been dramatically expanded [1]. Abnormal spindle like primary microcephaly (ASPM) gene is thought to be associated with the evolution of brain size while the mutated version of ASPM identified to cause primary microcephaly (MCPH) [2]. Evolutionary studies across mammalian lineage particularly in primates focused on the association of brain size and ASPM gene showing to be positively correlated with cortical size in apes, old world and new world monkeys [3,4]. ASPM has shown signatures of adaptive evolution in the lineage leading to humans [5,6] and related to evolve of anatomically modern humans around 6000 years ago with the adaptive alleles rising to a worldwide frequency of around 30% [7]. Mekel-Bobrov et al. (2005) paper also notes that evolution at this gene is ongoing and did not stop when modern humans emerged. It was also hypothesized that ASPM may not only be involved in changes of cerebral cortex but also linked with linguistic pattern during evolution [8]. Although experimental attempts have failed to connect the implicated SNPs of ASPM genes with higher-level brain functions [9], a population-level study successfully linked the population frequency of ASPM alleles with the use of lexical tones [10]. However, genome-wide data are now being used for inferring migrations and admixture as well as for estimating population divergence and admixture times. Studies of the genetic history of human populations have relied largely on variation in the single-locus in particularly on genome wide SNPs [11]. Considering these points we hypothesized that ASPM gene could have contained variations based on geographical localization, which might be the signs of recent ongoing selection.
A different but relevant study found that non-synonymous SNPs of MCPH1 is associated with cranial volume in chinese males [12]. In another two gene FOXP2 and KIAA0319, SNPs were associated with variations of activation in the left frontal cortex, language impairment [13] and reading disability [14]. Schaschl and his co-worker analyzed SNP variation of OXTR and AVPR1a gene from 1000 Genomes data. They found a single SNP showing sign of positive selection when tested in Fst method [15]. It is well accepted that SNPs are one of the most common and functionally important genetic variations in human. SNPs provide the most stable and reliable indicators of the evolutionary history of populations [16]. Latest advancement of 1000 genome project provides unbiased catalog of genetic variations existing between subpopulations of a population as well as within different populations across continents. Moreover, these variations are capable of making evolutionary inferences more precisely [17]. Analyses of these data indicated that common SNPs were frequently both shared and common among populations of predominately African, Asian, and European ancestry [18]. Common SNPs (minor allele frequencies (MAF) > 0.05) in whole genome studies for understanding the demographic history of human is also well accepted [17,19]. Identification of regions of the human genome, have been targeted by selection, has become a popular choice for understanding population differentiation [20]. However, inferences of selection are challenged by several confounding factors, especially the complex demographic history of human populations [21]. And natural selection can modulate the balance in allele frequencies across populations [22]. Fixation statistics (Fst) is a good option for investigating selection, utilizing differences in allele frequency between populations to infer selective pressure [22,23]. Analysis of regions where an allele conferring a selective advantage has risen in frequency, thus reducing diversity in a population can be calculated by Tajima's D statistic [24]. Hardy-Weinberg equilibrium (HWE) deviation can indicate inbreeding, population stratification, and even problems in genotyping. It is now common practice to check whether observed genotypes conform to Hardy-Weinberg expectations [25]. HWE for each SNP within each population could be calculated on the basis of a comparison of observed and expected heterozygosities [26]. Considering every facets, a deeper understanding of population-specific SNP variations can be correlated to genographic distribution. And many questions in human evolution involve specific migrations for which population-specific alleles are most informative [11]. So population based analysis of SNPs is essential to understand the evolutionary history and ongoing evolutionary focus of ASPM gene among geographically separated diverse population [27-29]. So far no one extensively analyzed the SNPs of ASPM with a varying demographic background using population genetic statistics. The primary aim of this study was to understand population diversity, evolutionary history, and genographic pattern of ASPM gene on the basis of SNP variation.
Materials and Methods
Data Retrieval and Processing
VCF files of population specific SNP data were retrieved from the ftp server of the 1000 Genome project (Recent version-Phase 3 Release) [30,31]. Ensembl version 76 was used to explore 1000 genome data (http://browser.1000genomes.org) particularly for ASPM gene [32]. The starting point of the analysis was a variant call format (VCF) file version 4.2 [33]. This is a text file containing information about variant positions, reference and alternative bases, and genotypes per sample. Ensembl data slicer was used which allowed an interface to obtain the ASPM genic region spanning 1:197053258-197115824 of Chromosome 1 either in VCF or BAM format based on genomic coordinates. Sub sequentially, a VCF file URL accompanied by tabix index was provided to the data slicer along with a sample-population mapping file URL to guide data slicer for getting population specific variation data. The VCF file URL and the sample-population mapping file URL is provided below this paragraph. All analysis ran within a standard Linux operating system (BioLinux 8) [34].
ftp://ftp.1000genomes.ebi.ac.uk/vol1/ftp/release/20130502/ALL.chr1.phase3_shapeit2_mvncall_integrated_v5a.
20130502.genotypes.vcf.gz
ftp://ftp.1000genomes.ebi.ac.uk/vol1/ftp/release/20130502/integrated_call_samples_v3.20130502.ALL.panel
Selection of Study Populations
The 1000 genome project consists of a total of 26 sub-populations under five major populations (Americans, Europeans, East Asians, South Asians and Africans) (The 1000 Genomes Project Consortium 2012). We selected four major populations (European, East Asian, South Asian and African) comprising 16 potentially independent and essentially non-admixed subpopulations (shown in Figure 1) for analysis. American population was excluded from our study due to recent history of population admixture with different background in USA and other regions of American continent [17]. Primarily, 1000 genome project included total 2577 samples. But 411 European (GBR, FIN, IBS and TSI), 411 East Asian (CHB, CDX, JPT and KHV), 430 African (GWD, LWK, MSL and YRI) and 388 South Asian (BEB, ITU, PJL and STU) were selected and included in our study.

Figure 1: Genomic and proteomic organization of ASPM adopted from Ensembl [32,52]. Positions of polymorphic bases (SNPs) derived from the 1000 genome Ensembl browser and 1000 Genome single nucleotide polymorphism (SNP) database [31].
Statistical Analysis
We used several population based computational and statistical methods that includes minor allele frequency distribution (MAF) analysis, frequency-based methods (Tajima’s D), population differentiation-based method (Fixation statistics: Fst), and linkage disequilibrium based method (Hardy–Weinberg equilibrium: HWE) [35]. But we did not perform LD tests or measurements around this gene. Finally, Venn analysis was performed to sort out population specific SNPs and manually we generated a genographic tree.
MAF Analysis
We performed MAF analysis as described by Choudhury et al. [17]. The distribution of the common SNPs of ASPM gene for each sub-population was calculated considering 16 populations only. Calculation was performed in VCF tools after removing indels and filtering out rare and private SNPs. The resulting SNPs were described as common in a population as the MAF was observed to be greater than 0.05 (MAF>0.05) in respective populations. Later, these common SNPs were used for Venn analysis.
Fst Statistics
The Fst method described by Weir and Cockerham was applied here in this study [36]. The ASPM-SNP data from the VCF files after removing the indels were used to calculate FST between each pair of populations [37]. Calculation of comparison between two population were executed in VCF tools (version 0.1.11) by providing VCF files for all individuals as input data and text file listing individual IDs belonging to each population [33].
Tajimas D Analysis
Identification of SNP enriched genic regions in ASPM was performed using Tajimas D method as described by Cadzow et al. [37]. It is a site by site frequency spectrum based method for detecting selective pressure. Four major populations SNPs data were used as input file after removing indels. A 3kbp window was used for calculations. MAF filter was not used in this step in order to consider all the SNPs (Rare and Common) distributed along ASPM gene. It is generally accepted that an absolute value of 2 or more as a rule of thumb for statistical significance of D.
HWE Test
Hardy–Weinberg equilibrium test were performed according to Vitti et al. [35]. HWE of all the four populations were tested by VCF tools after recoding all the subpopulation’s VCF files with filters set to 0.05 MAF and removing indels. Output files were viewed in Haploview 4.2 [38]. The results were explored and filtered according to p-value and plotted.
Venn Analysis and Genographic Tree Construction
MAF analysis derived common SNPs were used as input for Venn analysis to find out shared and population specific SNPs of ASPM. BioVenn online based software was used to perform Venn analysis [39]. From the Venn results and diagram we found a genographic pattern among these populations based on ASPM common population SNPs. Finally, we reconstructed a tentative genographic tree encouraged by The Genographic Project [40].
Results and Discussions
SNPs of ASPM
Human ASPM is located at chromosome-1 reverse strand in MCPH5 locus [32]. It encodes a 10,434-bp-long coding sequence (CDS) with 28 exons, and spans 65 kb of genomic DNA at 1q31. ASPM contains four distinguishable regions: a putative N-terminal microtubule-binding domain, a calponin-homology domain, an IQ repeat domain containing multiple IQ repeats (calmodulin-binding motifs), and a C-terminal region [41]. 1000 genome Ensembl browser enables a graphical interface titled Variation image providing information of SNPs and Indels shown in Figure 1.
The1000 Genome Project and Studied Populations
The 1000 Genomes project has been a milestone in the identification of numerous novel SNPs and provides an unbiased estimate of human genetic variation across many populations worldwide [31]. And international HapMAP project was a former project that has made similar attempts but latest 1000 genome comprises more populations with higher coverage and sample size [42]. From all 26 subpopulations covered by 1k genome, we selected 16 subpopulations. Figure 2 represents the populations of 1000 Genome projects with their geographical location. The populations are FIN: Finnish in Finland; TSI: Toscani in Italia; IBS: Iberian Populations in Spain; GBR: British from England and Scotland; CHB: Han Chinese in Beijing, China; JPT: Japanese in Tokyo, Japan; CDX: Chinese Dai in Xishuangbanna, China; KHV: Kinhin Ho Chi Minh City, Vietnam; LWK: Luhya in Webuye, Kenya ; YRI: Yoruba in Ibadan, Nigeria; GWD: Gambian in Western Divisions in the Gambia, MSL: Mende in Sierra Leone; BEB: Bengali from Bangladeshi; ITU: Indian Telugu from the UK; PJL: Punjabi from Lahore, Pakistan; STU: Srilankan Tamil from the UK. The new 1000 genomes population dataset contains 5 major geographically distinct population group (Africa, East Asia, South Asia, Europe, America) including 26 population gives a broader field to explore. However, it includes admixed and related populations. We excluded American populations and four subpopulations (CHS, GIH, ESN and CEU) whom were migrated to America (GIH and CEU) and highly related populations present in the same major group (ESN related to YRI and CHS related to CHB) [17].
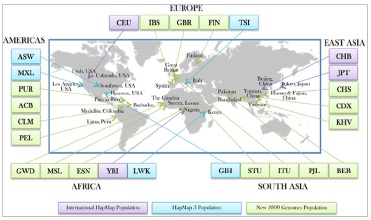
Figure 2.Geographic distribution of populations studied by different genome projects.International HapMap Population [41], HapMap 3 Population [53] and New 1000 Genome Population [31].
Identifying Common SNPs to Each Population
The highest number of common ASPM-SNPs was observed among the African population, especially in YRI and then followed by LWK, MSL and GWD respectively. Our observation is consistent with other investigations, i.e. one study showed populations of African origin carry up to 3X as many rare variants as European or East Asian populations [43]. There are number of factors involved behind this higher number of variations that shaped African population history including geographical barrier, drastic environmental shifts and epidemics; with incidental bottleneck, migration and interbreeding event [44,45]. LWK and GWD shared 42 common SNPs suggesting shared ancestry, although they are geographically separated being LWK (Eastern African) and GWD (North-Western African). The Luhya are classified as a Niger-Congo population and are Bantu-speaking, and LWK along with other Bantu-speaking populations, have migrated to East Africa at different time points in history [46]. This migration event might have been followed by population admixture and that was reflected in the current finding [47]. Interestingly, South Asian and European found to have similar numbers of SNPs in ASPM which discussed later in this study. The frequencies of common SNPs based on numbers in these populations have been summarized in Figure 3. Within South Asian subpopulations there are similar number of common SNPs and almost all are shared, indicated demographic history of population admixture (Xu 2012). Within European population GBR showed distinct number of SNPs compared to IBS, TSI and FIN. East Asians have fewer common SNPs than other three major populations but sub-populations shows uniformity in SNP numbers.
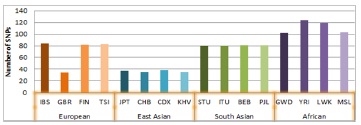
Figure 3.Common SNPs in the 1000 genomes data for ASPM gene.The number of common SNP (MAF>0.05) for each of the 16 populations.
Distance among Populations
Fst data reflected that South Asian population surprisingly has little difference with European population having a mean Fst estimate of 0.014534 whereas SA and EA had an estimated mean Fst of 0.076376. But the value between EA and EU is 0.12402 implying distant relation of this population compared to South Asian (figure 4).The other results are significantly higher than the cutoff indicating AF population is the most distant than other three populations. The reason may be the demographic history and segregated nature of ASPM gene among populations.
A study based on genetic variation found that South Asian cluster shows somewhat shorter genetic distances with West Eurasian than with East Asian populations [48]. Our analysis, consistent with the mentioned study showed lowest Fst score between South-Asian populations and European population. Within South Asian population we found same number of common SNP and all were shared among four South Asian subpopulation consisting Dravid lineages (STU and ITU), North Indian lineages (PJL) and mixed Bengali lineages (BEB). Metspalu and his colleagues analyzed the mean pairwise FST values and reported that the South Asian autosomal gene pool falls into a distinct geographic cluster by short interpopulation genetic distances supporting what we found in Fst calculation and MAF analysis [49].
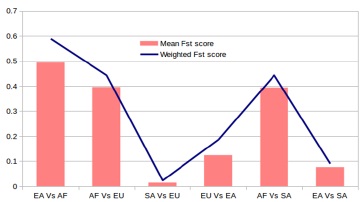
Figure 4.Per-site Fst calculation within two populations. Plot of Fst values across ASPM gene based on 1000 genome project data. A 1kbp window was used for calculations. Blue horizontal polygonal line is the weighted Fst score among populations and pink vertical columns are the mean score.
Regions with Selective Pressure in the ASPM Gene of Diverse Population
Tajima’s D is suitable for detecting evidence of positive selection in human populations occurring within the past 250,000 years [23] or approximately 10,000 generations, and operates by identifying an excess of low-to-intermediate frequency variants [37]. The plots in figure 5 show clear evidence for differing degrees of selective pressure in the ASPM gene among the populations. European population spanned a greater range of positive and negative D value compared to other. The mid-region of the gene shows more deviation especially from 197070kbp to 197090kbp suggesting enriched region with possible selective pressure. However, Tajima's D is known to come out negative when the population size is expanding also. Positive selection acting on this region further need to be measured and testified because we measure population parameters that might have unusual values as caused by many different features of which selection is just one factor. Considering other demographic features that might cause some "interesting" results including our results could be a good option for study.
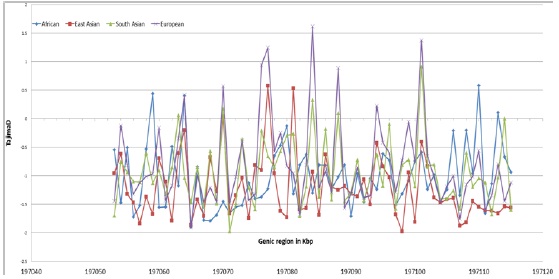
Figure 5. Plot of Tajima’s D values across ASPM gene based on 1000 genome project data for the four major populations.
Hardy-Weinberg Equilibrium of Four Major Populations
The Hardy–Weinberg principle states that allele and genotype frequencies in a population will remain constant from generation to generation in the absence of other evolutionary influences. When observed allele frequency is highly deviated from the expected frequency there must be an evolutionary pressure present playing some roles [50]. Specific SNPs sometimes are subjected to evolutionary pressure which can be effectively detected by plotting observed vs. expected heterozygosity from allele frequency data and a corresponding lower p-value suggests that particular site is significantly under selection [51]. The Figure 6 shows significant HWE result of four different populations. The result is quiet overwhelming; the values of Hardy-Weinberg statistics between South Asians are highly similar with Europeans. South Asian population showed striking similarity with European population and all the five SNPs (rs6700180, rs10801589, rs10922163, rs10754216, rs3737111) are present among both populations with very low p-value. They share same SNPs that are not in equilibrium with highly similar p-value East Asians also share those SNPs that but with a higher value. African population possesses a different set of SNPs that are of significance.
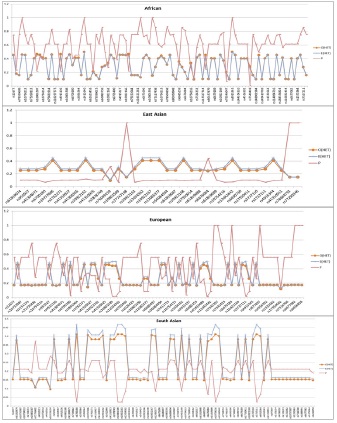
Figure 6.Hardy–Weinberg plot of four major populations. The X-axis showing corresponding SNP ID and Y axis is the value. The blue line represents expected heterozygosity and orange line is observed heterozygosity. The p-value is represented by red polygonal line. A very low p-value (0.2~0.05) suggest undergoing selective pressure on that specific site.
Shared and Population Specific Common SNPs
Venn diagram and Venn derived table showing (Figure7 and Table 1) the shared and population specific common SNPs for major populations and their subpopulations. 11 common SNPs were found to be present all major populations and 20 SNPs found in both Asians and Europeans but not for Africans. Large number (135) of population specific common SNPs suggest diverse and isolated characteristic of ASPM genetic variation among African population.
Among African YRI subpopulation 45 SNPs found to be specific and in European subpopulations 48 SNPs were shared among TSI, FIN and IBS but not present in GBR.
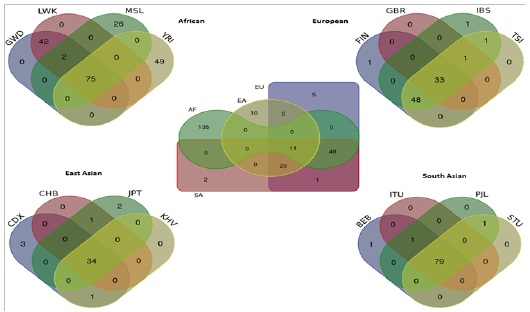
Figure 7. SNPs based Venn diagram for the 4 major continentals and 16 sub-populations. FIN: Finnish in Finland, TSI: Toscani in Italia, IBS: Iberian Populations in Spain, GBR: British from England and Scotland; CHB: Han Chinese in Beijing, JPT: Japanese in Tokyo, CDX: Chinese Dai in Xishuangbanna, KHV: Kinhin Ho Chi Minh City; LWK: Luhya in Webuye, Kenya ; YRI: Yoruba in Ibadan, Nigeria; GWD: Gambian in Western Divisions in the Gambia, MSL: Mende in Sierra Leone; BEB: Bengali from Bangladeshi; ITU: Indian Telugu from the UK; PJL: Punjabi from Lahore, Pakistan; STU: Srilankan Tamil from the UK
|
Population Names |
No. |
SNPs ID |
Remarks |
|
BEB. CDX. YRI. CHB. FIN. GBR. GWD. IBS. ITU. JPT. KHV. LWK. MSL. PJL. STU. TSI. |
06 |
rs6700180, rs10922163, rs6676084, rs3737111, rs10801589, rs10754216 |
Common SNPs that are shared by all population. |
|
BEB. CDX. CHB. FIN. GBR. GWD. IBS. ITU. JPT. KHV. LWK. MSL. PJL. STU. TSI. |
01 |
rs12042442 |
Absent in YRI. But HWE significant in EA and AF. |
|
BEB. CDX. CHB. FIN. GBR. GWD. IBS. ITU. JPT. KHV. TSI. LWK. PJL. STU. |
04 |
rs4915344, rs12085377, rs10922167, rs10922168 |
Derived SNPs. Absent in MSL and YRI. |
|
BEB. CDX. TSI. CHB. FIN. GBR. IBS. ITU. JPT. KHV. PJL. STU. |
20 |
rs12034362, rs955927, rs10922162, rs41310911, rs3762271, rs41308365, rs3737110, rs61819074, rs61819088, rs2878749, rs10737686, rs6690730, rs41310925, rs41304071, rs17550411, rs61819089, rs17550014, rs56084994, rs41310927, rs61819087 |
Absent in African. |
|
BEB. FIN. YRI. GWD. IBS. ITU. LWK. MSL. PJL. STU. TSI. |
47 |
rs10801591, rs7539642, rs1332662, rs6679189, rs12677, rs6671696, rs10801587, rs6428387, rs10737687, rs2151134, rs10733087, rs10922169, rs10754213, rs2151133, rs7534353, rs1953064, rs2026429, rs4915315, rs877897, rs6695300, rs4915327, rs1332663, rs4915337, rs10801590, rs7541429, rs10754215, rs4556392, rs2151135, rs1888991, rs1571964, rs4915345, rs1412640, rs10801588, rs1034162, rs3891964, rs7411719, rs10922166, rs6703400, rs7516700, rs6656858, rs10754214, rs6677082, rs4915316, rs7542397, rs10922165, rs4915156, rs6685259 |
Absent in East Asia n. |
|
BEB. GWD. IBS. ITU. LWK. MSL. PJL. STU. TSI. YRI. |
01 |
rs6680497 |
Not classifiable. |
|
GBR. IBS. PJL. STU. TSI. |
01 |
rs72736482 |
Not classifiable. |
|
GWD. LWK. MSL.YRI. |
21 |
rs75268113, rs79222044, rs1537318, rs79396025, rs80058948, rs114086766, rs78390689, rs80238010, rs16841081, rs7527211, rs116321281, rs74434834, rs60883759, rs79246047, rs115407329, rs75117458, rs78504858, rs116115588, rs7549438, rs184556824, rs74981632 |
Pure AF SNPs |
|
CDX. CHB. JPT. KHV. |
03 |
rs77747198, rs77290346, rs78684793 |
Pure EA SNPS. |
|
FIN. GBR. IBS. TSI. |
02 |
rs12138336, rs12116571 |
Pure EU SNPs |
|
GWD. LWK. MSL. |
01 |
rs149648792 |
Niger-congo and Bantu speaking groups |
|
FIN. IBS. TSI. |
01 |
rs17550662 |
Present in EU population except GBR. |
|
BEB. ITU. PJL. |
01 |
rs193251130 |
SA SNPs but absent in STU. |
|
GWD. LWK. |
38 |
rs112214972, rs148790634, rs112887421, rs113716487, rs144265058, rs139443466, rs138300677, rs139830165, rs112647911, rs140776310, rs113325473, rs111299108, rs113682374, rs111898030, rs144323054, rs138530804, rs148224192, rs111996942, rs141264821, rs180997394, rs151246093, rs141537070, rs112230218, rs111487086, rs143757192, rs148922450, rs568313742, rs114092816, rs151140524, rs146733338, rs111753423, rs116522706, rs146636250, rs138191108, rs114328711, rs151121874, rs115045814, rs113611857 |
Bantu-speaking population specific SNPs. |
|
CDX. KHV. |
01 |
rs16841135 |
Sino-Vietnamese SNPs |
|
CHB. JPT. |
01 |
rs76099159 |
Sino-Japanese SNP |
|
MSL |
26 |
rs116644096, rs114737609, rs116832434, rs114695225, rs143578609, rs77334194, rs61995747, rs113388571, rs148902984, rs149419769, rs62623455, rs115527514, rs35203521, rs149033568, rs115216923, rs144354310, rs114894716, rs139855488, rs144923756, rs62624965, rs116297575, rs145908430, rs80157479, rs149881952, rs141402675, rs79431914 |
MSL specific SNPs, ancestral in nature with significant SNP number. |
|
YRI. |
49 |
rs11806768, rs56912014, rs114034848, rs114155977, rs75452000, rs35897746, rs7534439, rs116267637, rs115716898, rs115786119, rs78484497, rs7528827, rs115991776, rs115144694, rs144671035, rs116372001, rs80330588, rs61249253, rs76822237, rs138154584, rs74820344, rs79572771, rs140720972, rs60769813, rs114883540, rs115201296, rs116489528, rs62624968, rs6428388, rs115195513, rs6675840, rs114071210, rs74336995, rs114569274, rs114765484, rs114139619, rs80077744, rs76781168, rs74136085, rs7520405, rs77138363, rs115983216, rs116334886, rs115728332, rs77956746, rs78930407, rs116065919, rs59560396, rs114786366 |
Enormous YRI specific SNPs most ancestral having deep historical root. |
|
CDX. |
03 |
rs144175554, rs79484782, rs117963393 |
CDX specific. |
|
JPT. |
02 |
rs78672387, rs79928617 |
JPT specific. |
|
FIN. |
01 |
rs668049 |
FIN specific. |
|
IBS. |
01 |
rs36004306 |
IBS specific. |
|
BEB. |
01 |
rs191122530 |
BEB specific. |
Table 1: List of population specific SNPs of ASPM gene with ID and remarks based on Venn analysis.
Tentative Genographic Relations among Populations
From the Venn diagram it was possible to screen out population specific common SNPs and we found a genographic pattern among these population. 11 SNPs were common among all the population suggested that they are most ancient variation. After the split known as out of Africa, African population acquired 135 variations that are specific to them and not shared by any other population that have descended from the African origin and migrated toward Europe and Asia. The Eurasian lineage acquired 20 more SNPs that are shared by all three Eurasian populations. East Asian population then split and resulted in 10 SNPs specific to them and surprisingly they don’t possess any SNP common with neither Europe only nor South Asian only. This result suggests that their divergence occurred a long ago and very few interbreeding event occurred between East Asians and other populations until recently. However, European and South Asian shared just a single SNP that is not shared by any other population suggest a very little interbreeding and mixing. European acquired 5 SNPs specific to them and South Asians only 2. This can be correlated to the time of splitting and that must be very recent in comparison with East Asians and African population. Finally we illustrated the genographic tree (Figure 8).
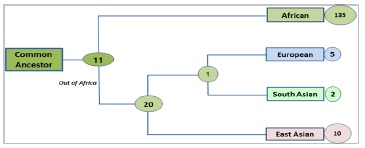
Figure 8.Genographic tree of the studied population based on ASPMSNPs. The genographic tree according to population specific common SNPs showing the pattern of population diversion. The tree length is showing the divergence and the number of SNP are the strength of that particular branch.
Later we compared our generated genographic tree with the NAT GEO genographic human migration routes (Figure 9) to find out the fitness of ASPM based tree. Surprisingly, we found some similarities, particularly the segregation points East Asia, South Asia and Europe.
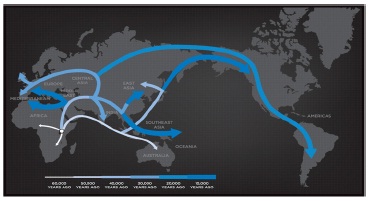
Figure 9. The Human Journey: Migration Routes (Adapted from The Genographic Project, National Geographic Society 2015 [42])
Conclusion
Human are a successful species with enormous population and immense variation. This diversity demands variation based study. Evolution never stops and geographically separated populations are a fertile ground for performing such analysis. 1000 genome project data is best for performing population based study across whole genome and also genomic region. Analyzing ASPM gene among four major populations based on 1000 genome project data revealed key differences in variation of SNP specially common population specific SNPs that are exclusively present in a specific population with a MAF value of ≥0.05 and may or may not be present in others. The statistical analysis revealed they are significantly distant than each other (Weir and Cockerham’s Fst test) and the value of distance also correlates with geographic distance and demographic history. Tajima’s D and Hardy Weinberg equilibrium statistics also showed robust variation among populations and individual SNP marker with selective pressure. The time scale over which selection has occurred has a major impact on the ability of each method to detect evidence of its presence. Nevertheless such attempt does not exempted from assertion bias specially when studying a single gene. However, our single gene based analysis is consistent with other whole genome based study making it a practicable way for performing population study and making genographic inferences.
Acknowledgement
The authors would like to thank SO FirozParvej, IE, Atomic Energy Research Establishment for his help in solving software based technical problems. We are also grateful to Dr. SirajeArif Mahmud, Jahangirnagar University for his valuable suggestions throughout the study.
Conflict of Interest
None of the authors have any conflicts of interest to declare.
References
- Vallender EJ, Lahn BT (2004) Positive selection on the human genome. Hum Mol Genet 13: R245-R254.
- Gilbert SL, Dobyns WB, Lahn BT (2005) Genetic links between brain development and brain evolution. Nat Rev Genet 6: 581-590.
- Montgomery SH, Capellini I, Venditti C, Barton RA, Mundy NI (2011) Adaptive Evolution of Four Microcephaly Genes and the Evolution of Brain Size in Anthropoid Primates. Mol Biol Evol 28: 625-638.
- Villanea FA, Perry GH, Gutiérrez-Espeleta GA, Dominy NJ (2012) ASPM and the Evolution of Cerebral Cortical Size in a Community of New World Monkeys. PloS One 7: e44928.
- Evans PD, Anderson JR, Vallender EJ, Gilbert SL, Malcom CM, et al. (2004) Adaptive evolution of ASPM, a major determinant of cerebral cortical size in humans. Hum Mol Genet 13: 489-494.
- Kouprina N, Pavlicek A, Mochida GH, Solomon G, Gersch W, et al. (2004) Accelerated evolution of the ASPM gene controlling brain size begins prior to human brain expansion. PLoS Biol 2: E126.
- Mekel-Bobrov N, Gilbert SL, Evans PD, Vallender EJ, Anderson JR, et al. (2005) Ongoing adaptive evolution of ASPM, a brain size determinant in Homo sapiens. Science 309: 1720-1722.
- Vallender EJ (2012) Genetic correlates of the evolving primate brain. Prog Brain Res 195: 27-44.
- Wong PC, Chandrasekaran B, Zheng J (2012) The Derived Allele of ASPM Is Associated with Lexical Tone Perception. PLoS One 7: e34243.
- Dediu D, Ladd DR (2007) Linguistic tone is related to the population frequency of the adaptive haplogroups of two brain size genes, ASPM and Microcephalin. Proc Natl Acad Sci U S A 104: 10944-10949.
- Pugach I, Stoneking M (2015) Genome-wide insights into the genetic history of human populations. Investig Genet 6: 6.
- Wang JK, Li Y, Su B (2008) A common SNP of MCPH1 is associated with cranial volume variation in Chinese population. Hum Mol Genet 17: 1329-1335.
- Pinel P, Fauchereau F, Moreno A, Barbot A, Lathrop M, et al. (2012) Genetic variants of FOXP2 and KIAA0319/TTRAP/THEM2 locus are associated with altered brain activation in distinct language-related regions. J Neurosci 32: 817-825.
- Hoogman M, Guadalupe T, Zwiers MP, Klarenbeek P, Francks C, et al. (2014) Assessing the effects of common variation in the FOXP2 gene on human brain structure. Front Hum Neurosci 8: 473.
- Schaschl H, Huber S, Schaefer K, Windhager S, Wallner B, et al. (2015) Signatures of positive selection in the cis-regulatory sequences of the human oxytocin receptor (OXTR) and arginine vasopressin receptor 1a (AVPR1A) genes. BMC Evol Biol 15: 85.
- Phillips C (2007) Online Resources for SNP Analysis: A Review and Route Map. Mol Biotech 35: 65-97.
- Choudhury A, Hazelhurst S, Meintjes A, Achinike-Oduaran O, Aron S, et al. (2014) Population-specific common SNPs reflect demographic histories and highlight regions of genomic plasticity with functional relevance. BMC Genomics 15: 437.
- Tishkoff SA, Williams CM (2002) Genetic analysis of African populations: human evolution and complex disease. Nat Rev Genet 3: 611-621.
- Schork AJ, Thompson WK, Pham P, Torkamani A, Roddey JC, et al. (2013) All SNPs Are Not Created Equal: Genome-Wide Association Studies Reveal a Consistent Pattern of Enrichment among Functionally Annotated SNPs. PLoS Genet 9: e1003449.
- Carlson CS, Thomas DJ, Eberle MA, Swanson JE, Livingston RJ, et al. (2005) Genomic regions exhibiting positive selection identified from dense genotype data. Genome Res 15: 1553-1565.
- Nielsen R, Hellmann I, Hubisz M, Bustamante C, Clark AG, et al. (2007) Recent and ongoing selection in the human genome. Nat Rev Genet 8: 857-868.
- Mattei J, Parnell LD, Lai CQ, Garcia-Bailo B, Adiconis X, et al. (2009) Disparities in allele frequencies and population differentiation for 101 disease-associated single nucleotide polymorphisms between Puerto Ricans and non-Hispanic whites. BMC Genet 10: 45.
- Sabeti PC, Schaffner SF, Fry B, Lohmueller J, Varilly P, et al. (2006) Positive natural selection in the human lineage. Science 312: 1614-1620.
- Tajima F (1989) Statistical method for testing the neutral mutation hypothesis by DNA polymorphism. Genetics 123: 585-595.
- Wigginton JE, Cutler DJ, Abecasis GR (2005) A Note on Exact Tests of Hardy-Weinberg Equilibrium. Am J Hum Genet 76: 887-883.
- Coates BS, Sumerford DV, Miller NJ, Kim KS, Sappington TW, et al. (2009) Comparative Performance of Single Nucleotide Polymorphism and Microsatellite Markers for Population Genetic Analysis. J Hered 100: 556-564.
- Stern R, Woods CG (2006) Evolutionary Genetics: Is brain evolution still continuing in modern humans? Eur J Hum Genet 14: 799-800.
- Wang JK, Li Y, Su B (2008) A common SNP of MCPH1 is associated with cranial volume variation in Chinese population. Hum Mol Genet 17: 1329-1335.
- Platter BE (2009) Evidence of Contemporary Modern Human Evolution Contained Within the Human Genome. Lethbridge Undergraduate Research J 4:1.
- The 1000 Genomes Project Consortium, Abecasis GR, Altshuler D, Auton A, Brooks LD, et al. (2011) A map of human genome variation from population-scale sequencing. Nature 467: 1061-1073.
- The 1000 Genomes Project Consortium, Abecasis GR, Auton A, Brooks LD, DePristo MA, et al. (2012) An integrated map of genetic variation from 1,092 human genomes. Nature 491: 56-65.
- Cunningham F, Amode MR, Barrell D, Beal K, Billis K, et al. (2015) Ensembl 2015. Nucleic Acids Res 43: D662-D669.
- Danecek P, Auton A, Abecasis G, Albers CA, Banks E, et al. (2011) Genomes Project Analysis G: The variant call format and VCF tools. Bioinformatics 27: 2156-2158.
- Field D, Tiwari B, Booth T, Houten S, Swan D, et al. (2006) Open Software for biologists: from famine to feast. Nature Biotechnol 24: 801-803.
- Vitti JJ, Grossman SR, Sabeti PC (2013) Detecting Natural Selection in Genomic Data. Annu Rev Genet 47: 97-120.
- Weir BS, Cockerham CC (1984) Estimating F-statistics for the analysis of population structure. Evolution 38: 1358-1370.
- Cadzow M, Boocock J, Nguyen HT, Wilcox P, Merriman TR, et al. (2014) A bioinformatics workflow for detecting signatures of selection in genomic data. Front Genet 5: 293.
- Barrett JC, Fry B, Maller J, Daly MJ (2005) Haploview: analysis and visualization of LD and haplotype maps. Bioinformatics 21: 263-265.
- Hulsen T, de Vlieg J, Alkema W (2008) BioVenn– a web application for the comparison and visualization of biological lists using area-proportional Venn diagrams. BMC Genomics 9: 488.
- https://genographic.nationalgeographic.com/
- Bond J, Roberts E, Mochida GH, Hampshire DJ, Scott S, et al. (2002) ASPM is a major determinant of cerebral cortical size. Nat Genet 32: 316-320.
- The International HapMap Consortium (2003) The International HapMap Project. Nature 426: 789-796.
- http://massgenomics.org/2012/11/human-genetic-variation-1000-genomes.html#comments
- Campbell MC, Tishkoff SA (2008) African genetic diversity: implications for human demographic history, modern human origins, and complex disease mapping. Annu Rev Genomics Hum Genet 9: 403-433.
- Triska P, Soares P, Patin E, Fernandes V, Cerny V, et al. (2015) Extensive admixture and selective pressure across the Sahel Belt. Genome Biol Evol 7: 3848-3895.
- https://catalog.coriell.org/0/Sections/Collections/NHGRI/Luhya.aspx?PgId=360
- Tishkoff SA, Reed FA, Friedlaender FR, Ehret C, Ranciaro A, et al. (2009)The genetic structure and history of Africans and African Americans. Science 324: 1035-1044.
- Xing J, Watkins WS, Witherspoon DJ, Zhang Y, Guthery SL, et al. (2009) Fine-scaled human genetic structure revealed by SNP microarrays. Genome Res 19: 815-825.
- Metspalu M, Romero IG, Yunusbayev B, Chaubey G, Mallick CB, et al. (2011) Shared and Unique Components of Human Population Structure and Genome-Wide Signals of Positive Selection in South Asia. Am J Hum Genet 89: 731-744.
- Herron JC, Freeman S (2014) The Hardy-Weinberg equation can be used to test whether a population is evolving. Natural selection, genetic drift, and gene flow can alter allele frequencies in a population. The Evolution of Populations, Evolutionary Analysis, 5/E, Pearson publishers Chapter 23: 483-487.
- Oleksyk TK, Zhao K, De La Vega FM, Gilbert DA, O'Brien SJ, et al. (2008) Identifying Selected Regions from Heterozygosity and Divergence Using a Light-Coverage Genomic Dataset from Two Human Populations. PLoS One 3: e1712.
- Hartl DL, Clark AG (1997) Principles of Population Genetics, 3nd edn. Sinauer Associates, Inc, Sunderland, MA.
- International HapMap 3 Consortium, Altshuler DM, Gibbs RA, Peltonen L, Altshuler DM, et al. (2010) Integrating common and rare genetic variation in diverse human populations. Nature 467: 52-58.