Research Article
Authors:
Photios Anninos1*, Adam Adamopoulos1, Nicolaos Tsagas2, and Athanasia Kotini1
1Labratory of Medical Physics, Department of Medicine, School of Health Sciences, Alexandroupoli, Greece
2Department of Electrical Engineering, Polytechnic School, Democritus University of Thrace, Xanthi, Greece
Corresponding author
Photios Anninos, Emeritus Professor, Laboratory of Medical Physics, Department of Medicine, School of Health Sciences, Democritus University of Thrace, University Campus, Alexandroupoli 68100, Greece. Tel: +302551030392, Fax: +302551030392 E-mail: pans.photios.anninos@gmail.com
Received Date: 07 March 2018; Accepted Date: 30 March 20 18; Published Date: 05 April 2018
Citation
P.Anninos, A.Adamopoulos,Tsagas N,A.Kotini (2018) Pico- Tesla TMS on Migraine Patients with A Double Blind Experimental Design. Enliven: Neurol Neurotech 5(1): 001.
Copyright
@ 2018 Photios Anninos. This is an Open Access article published and distributed under the terms of the Creative Commons Attribution License, that permits unrestricted use, distribution and reproduction in any medium, provided the original author and source are credited.
Abstract
Transcranial magnetic stimulation (TMS) is a noninvasive method for treating neurological disorders. The aim of this study is to identify any change in the brain state in migraine patients after Pico-Tesla (pT)-TMS application. Magneto encephalographic (MEG) recordings of 30 Migraine patients were obtained using a whole-head 122 - channel MEG system in a magnetically shielded room of low magnetic noise. The subjects were 12 male and 18 female volunteers between 45-67 years of age. A double-blind experimental design was used in order to look for possible effects of external Pico - Tesla TMS on migraine patients. The results were statistically significant at 22 out of 30 patients (73.3%). We observe that 8 out of 30 patients (26.7%) had partial improvement whereas 22 out of 30 patients (73.3 %) had improvement to pT-TMS. From our study population 12 out of 18 women (66.7%) and 10 out to 12 men (83.3%) had improvement to pT-TMS. The pT-TMS has the potential to be an important non invasive safe and efficacious modality in the management of idiopathic migraine patients.
Introduction
Transcranial magnetic stimulation (TMS) of several Tesla demonstrated by Baker et al. [1] is being explored as a noninvasive technique for treating neurological disorders and exploring brain function [2]. Anninos and Tsagas [3] suggested an electronic device that emits pico-Tesla (pT) TMS (1 pico Tesla=10-12 Tesla) and increase the abnormal (2-7 Hz) frequencies of the brain activity towards frequencies of less than or equal to those frequencies of the alpha frequency range (8-13Hz) of each individual subject [4-13]. One possible electrophysiological explanation for the efficacy of pT-TMS has been provided by the proposed “Neural Net Model” [11] which suggests that magnetic stimulation causes a temporally modulated neuronal inhibition in regions exhibiting abnormal activity in the frequency range of 2-7Hz. This hypothesis is in concordance with data presented by other investigators [14-16].
The aim of this study is to identify any change in the brain state consistent with our predictions that the pT helmet electronic device should increase the mean peak frequency difference (MPFD) within the 2-7Hz band towards frequencies of less than equal to those frequencies of the alpha frequency range (8-13Hz) for each individual migraine patient.
Materials and Methods
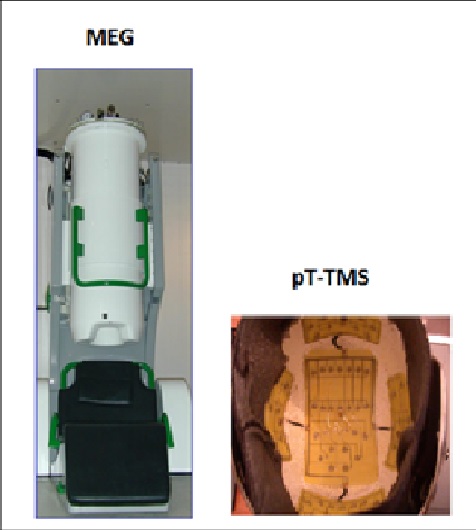
Biomagnetic measurements were performed using a whole-head 122-channel SQUID gradiometer device (Neuromag-122, Neuromag Ltd. Helsinki, Finland) (Figure 1). Recordings were taken in an electromagnetically shielding room in order to avoid extraneous electromagnetic noise. The spontaneous MEG recordings were taken with a sampling frequency rate of 256Hz and the associated Nyquist frequency was 128Hz, which was well above the constituent frequency components of interest in our MEG recordings, so as to avoid aliasing artifacts. The MEG signal was filtered with cut-off frequencies at 0.3 and 40Hz. The subjects were 12 male and 18 female volunteers between 45-67 years of age. Informed consent was obtained from all individual participants included in the study. The research was approved by our Research Committee (code number 80347). All patients were referred to our Laboratory, by practicing neurologists. They were off medication for 24 hours during their participation in the study. In our study we didn't include healthy subjects as controls because this research has been published by Troebinger et al. [17], in which they have used a double-blind experimental design with pico Tesla electronic device [3] in order to look for an effect of pT-TMS in healthy subjects.
Figure 1:The 122-channel MEG system and the pT-TMS electronic device
Figure 1: The 122-channel MEG system and the pT-TMS electronic device
The time taken for each recording was 2 min in order to ensure alertness for each subject. Each patient was scanned in two separate sessions. During each MEG scan the subject had no task and was asked to sit comfortably in the MEG chair.
The first session (session 1) consisted of a 2-minute resting state MEG Scan. These data were subsequently used to establish the subject’s alpha frequency in the range of (8-13 Hz), for calibration of the pT-TMS electronic device. In the second session (session 2), the protocol was as follows: At all times the pT-TMS electronic device which was connected to the helmet was set to real or sham stimulation by a third party. Neither the researcher nor the participants were aware of the state of the device. First, 2 minutes of pre-stimulus baseline MEG data were recorded (run 1). Next, 2 minutes of real or sham pT-TMS stimulation were administered with the subject sitting comfortably just outside the scanner room. Following these 2 minutes of stimulation, a further 2 minutes of resting state MEG data were acquired (run 2). This was followed by another 2 minutes of stimulation- in this case the device was switched from sham to real or vice versa (by the third party)- and 2 more minutes of MEG scanning data were carried out (run 3).
The pT-TMS Electronic Device
The pT-TMS electronic device is a modified helmet containing up to 122 coils which are arranged in five array groups, so as to cover the main 7 brain regions (frontal, vertex, right and left temporal, right and left parietal, and occipital) of each subject (Figure 1B). It is designed to create pT-TMS range modulations of magnetic flux in the alpha frequency range (8-13Hz) of each patient. The pT-TMS device was configured for each individual to generate a square wave (so as to resemble the firing activity of neurons in the brain). Anninos et al. [10] modulated the magnetic field at the individual’s mean peak alpha frequency - generated in the subject’s occipital lobe [3]. The electronic device has an extra hidden switch to disable current flow to the helmet coils. This switch, controlling real or sham stimulation, was operated by a member of the technical support team, so that neither the subject nor the experimenter were aware of whether sham or real stimulation was applied (double blind design).
Spectral Estimates
A software program was developed in our laboratory in order to detect the amplitude of the primary dominant frequency of the power spectra of the MEG recordings obtained from each migraine patient and channel after the application of Fast Fourier Transform (FFT).
Analysis and Prediction of sham and stimulus runs
As it was indicated before in session 2 there are 3 data sets (run1, run2, run3) and the task is to identify where the sham stimulation was delivered (before recording run2 or before recording run3). Based on the frequency differences across all channel groups it was possible to make a prediction of the likely stage (run2 sham or run3 sham) of pT stimulation in each of the 30 recording MEG migraine patients.
The prediction from sham to real stimulation
In order to blindly identify real from sham stimulation it was necessary to predict the frequency increase due to pT-TMS from all recorded MEG channels. For this purpose the increase in primary dominant frequency from sham to real stimulation under the two conditions was calculated. Having this in mind, then it can be estimated either the average frequency difference for each brain channel by calculating the differences between each average frequency of (run1+run3) / 2 from the run2 if run3 is the sham and run2 is the real stimulation or the average frequency differences of (run1+run2) / 2 from run3 if the run2 is the sham and run3 is the real stimulation for the same patient in each brain channel as shown in the following equations 1 and 2.
Δf (2) = run 2 - (run1+run3)/2 (1)
Δf (3) = run3 - (run1+run2)/2 (2)
In these equations run1 is considered as the baseline MEG recording, being the same for both calculations. In order to obtain all the above differences from all brain channels a software program was developed also in our laboratory (using equations 1 and 2) to estimate the (MPFD) of (Δf(2) or Δf(3)) for both calculations. If after all these calculations we have a MPFD from Δf(2) in (equation 1) greater for a particular patient then run2 is the real stimulation and run3 the sham stimulation, or if the MPFD is greater from Δf(3) in (equation 2) then run3 is the real stimulation and the run2 will be the sham one.
The patients were not free of migraine and headaches during the experiment.
The time frame of our clinical investigations was in the following way:
1st day: MEG measurements in our lab (baseline run1). Application of sham stimulation and MEG recordings afterwards (run3).We found no significant differences in patients' MEG spectrum. There was no stimulation during run1 and run3.
2nd day: Interview by clinicians after the sham stimulation. Application of real pT-TMS (2 minutes) and MEG recordings afterwards (run2).The patients’ MEG spectrum was almost normal in the majority of the patients with absence most of the abnormal frequencies.
3rd day: Interview by the same clinicians after real stimulation. They confirmed our findings of our MEG recordings.
10th day: MEG recordings and evaluation by the same clinicians. Most of the patients reported a progressive deterioration of their pretreatment status.
To determine if the responses elicited in our lab were reproducible, the patients were advised to apply nightly at (23.00 pm) the pT-TMS treatment at home with the pT-TMS electronic device.
Results
We attempted to determine the order of stimulation (run2 sham or run3 sham) based on the MPFD as shown in Table 1. On each of the 30 migraine patients our predictions were based (run2 sham or run3 sham) on whichever order gave rise to the largest change in the MPFD from all MEG recorded channels.
In Table 1 based on the knowledge of the true stimulation sequence, the true effect of pT stimulation is shown. The largest Mean values indicate that our prediction for these migraine patients was correct (in 29 /30 cases). Based on the binomial test, the probability for correctly selecting 29 or more events from 30 is highly statistically significant.
|
Patients Code |
Run2 |
Run3 |
MEANMPFD |
|
1 |
Real stimulation |
Sham stimulation |
0.400>-0.177 |
|
2 |
Real stimulation |
Sham stimulation |
0.298>-0.217 |
|
3 |
Sham stimulation |
Real stimulation |
-1.451<1.892 |
|
4 |
Real stimulation |
Sham stimulation |
-0.384<0.021 |
|
5 |
Sham stimulation |
Real stimulation |
-0.549<-0.125 |
|
6 |
Sham stimulation |
Real stimulation |
-0.661<-0.307 |
|
7 |
Real stimulation |
Sham stimulation |
-0.243>-0.442 |
|
8 |
Sham stimulation |
Real stimulation |
-1.364<1.161 |
|
9 |
Sham stimulation |
Real stimulation |
-0.143<-0.089 |
|
10 |
Sham stimulation |
Real stimulation |
-0.571<0.580 |
|
11 |
Real stimulation |
Sham stimulation |
0.424>-0.091 |
|
12 |
Sham stimulation |
Real stimulation |
-0.022<0.115 |
|
13 |
Real stimulation |
Sham stimulation |
No clear |
|
14 |
Real stimulation |
Sham stimulation |
0.504>-0.534 |
|
15 |
Sham stimulation |
Real stimulation |
-0.431<0.877 |
|
16 |
Real stimulation |
Sham stimulation |
0.627>-0.0.92 |
|
17 |
Real stimulation |
Sham stimulation |
1.774>-0.732 |
|
18 |
Real stimulation |
Sham stimulation |
1.106>-0.732 |
|
19 |
Sham stimulation |
Real stimulation |
-0.296<0.694 |
|
20 |
Real stimulation |
Sham stimulation |
1.782>-0.986 |
|
21 |
Real stimulation |
Real stimulation |
-0.824<2.439 |
|
22 |
Sham stimulation |
Real stimulation |
-1.772<1.593 |
|
23 |
Real stimulation |
Sham stimulation |
0.944>-0.933 |
|
24 |
Sham stimulation |
Real stimulation |
-0.957<1.464 |
|
25 |
Real stimulation |
Sham stimulation |
1.938>1.748 |
|
26 |
Sham stimulation |
Real stimulation |
-0.062<0.005 |
|
27 |
Real stimulation |
Sham stimulation |
0.645>-0.085 |
|
28 |
Sham stimulation |
Real stimulation |
-0.713<0.702 |
|
29 |
Sham stimulation |
Real stimulation |
-1.772<1.593 |
|
30 |
Real stimulation |
Sham stimulation |
1.033>-1.322 |
Table1. This table shows the prediction to determine the order of stimulation (run2 sham or run3 sham) based on the mean MPFD. On each of the 30 migraine patients the prediction was based (run2 sham or run3 sham) on whichever order gave rise to the largest change in the mean MPFD from all MEG recorded channels. In Patient 13 the MPFD was not clear and after unblinding the prediction was correct in 29/30.
The application of pT-TMS literature suggests that the real stimulus runs should have a higher frequency than the sham runs. This was correct in our case after unblinding as it is shown in Table 1. Table 2 shows the brain regions and the corresponding channels in each brain region. Table 3 shows the symptoms in each of the 30 migraine patients after sham stimulation (2nd day in our lab) and real pT-TMS (3rd day in our lab). We observe that 8 out of 30 patients (26.7%) had partial improvement whereas 22 out of 30 patients (73.3%) had improvement to real pT-TMS. From them 12 out of 18 women had improvement to pT-TMS (66.7%) whereas 10 out to 12 men had improvement to pT-TMS (83.3%). Thus, in Tables 4, 5 the MPFD in real and sham stimulation for each of the seven brain regions are shown as stated in Table 2 for all 30 migraine patients. Table 6 represents the statistical analysis for the 15 patients of Table 4. The results were statistically significant at the level of 0.05. We observe that the results of 11 out of 15 patients were statistically significant (73.3%). Similarly, Table 7 represents the statistical analysis for the 15 patients of Table 5. We observed also that the results of 11 out of 15 patients were statistically significant (73.3%).
|
Brain Regions |
Channels |
|
Right Temporal |
1-14 ,111-120 |
|
Left Temporal |
43-50,55-62,67-74 |
|
Right Parietal |
5-6,11-16,97-100,109,110 ,115-122 |
|
Left Parietal |
47-52,59-64,71-74,79,80,87-90 |
|
Frontal |
17-42 |
|
Occipital |
75-86,91-96, 101-110 |
|
Vertex |
13-16,49-54,61-66,73,74,89,90,99,100, 117-122 |
Table2. This table shows the brain regions and the corresponding channels in each brain region.
|
Patients |
Sex |
Symptoms before pT-TMS |
Symptoms after Sham Stimulation |
Symptoms after real pT-TMS |
|
1 |
F |
She has attacks of headaches several a week with aura |
She has less headaches attacks per week |
improvement |
|
2 |
M |
He has Headaches and feeling nausea and vomiting |
No effect |
improvement |
|
3 |
M |
He has headaches on one side of the head typically at the front |
No effect |
improvement |
|
4 |
F |
She has moderate or severe headaches and is often described as pulsating |
No effect |
Partial improvement |
|
5 |
M |
He has headaches in the morning but may begin at any time of the day or night |
No effect |
Partial improvement |
|
6 |
F |
She has headaches and feeling sick(nausea) |
No effect |
Partial improvement |
|
7 |
F |
She has headaches and not liking bright lights or loud noises, so that she may just want to lie in a dark room |
She has moderate headaches |
improvement |
|
8 |
M |
He has migraine headaches attacks with aura |
He has attacks with aura |
improvement |
|
9 |
F |
She has headaches and feeling sick(nausea) |
She has headaches |
improvement |
|
10 |
F |
She has moderate or severe headaches and is often described as pulsating |
No effect |
improvement |
|
11 |
F |
She has headaches and feeling sick(nausea) |
No effect |
improvement |
|
12 |
F |
She has headaches attacks with aura |
No effect |
improvement |
|
13 |
F |
She has headaches and feeling sick(nausea) |
No effect |
improvement |
|
14 |
F |
She has moderate headaches |
She is feeling relaxed |
improvement |
|
15 |
M |
He has headaches in the morning but may begin at any time during the day |
No effect |
improvement |
|
16 |
M |
He has headaches on one side of his head typically at the front |
No effect |
Partial improvement |
|
17 |
M |
He has headaches attacks with aura |
No effect |
improvement |
|
18 |
M |
He has headaches and he was avoiding to lie in a bright room |
He is feeling relaxed |
improvement |
|
19 |
F |
She has moderate or severe some time headaches |
No effect |
improvement |
|
20 |
M |
He has headaches and feeling for vomiting |
No effect |
improvement |
|
21 |
F |
She has headaches several a week |
She is feeling relaxed |
Partial improvement |
|
22 |
F |
She has headaches and feeling for vomiting |
She has headaches and feeling for vomiting |
improvement |
|
23 |
F |
She has headaches attacks with aura |
No effect |
improvement |
|
24 |
M |
She has headaches several a week |
No effect |
improvement |
|
25 |
F |
She has moderate or severe some time headaches |
No effect |
Partial improvement |
|
26 |
F |
She has severe headaches and is often described as pulsating |
No effect |
Partial improvement |
|
27 |
F |
She has headaches and feeling sick(nausea) |
No effect |
Partial improvement |
|
28 |
M |
He has attacks of severe headaches with aura several a week |
No effect |
improvement |
|
29 |
F |
She has headaches on one side of her head typically at the front |
No effect |
improvement |
|
30 |
M |
He had headaches and he was avoiding to lie in a bright room |
No effect |
improvement |
Table3. This Table shows the symptoms of 30 migraine patients before pT-TMS, after sham stimulation (2nd day in our lab) and after real pT-TMS (3rd day in our lab) as were evaluated by interview by clinicians (F: Female; M: Male)
|
P |
RT |
RT |
LT |
LT |
RP |
RP |
LP |
LP |
F |
F |
V |
V |
O |
O |
|
1 |
5.0 |
1.7 |
3.8 |
4.1 |
4.9 |
4.1 |
3.6 |
3.8 |
4.8 |
3.0 |
4.9 |
4.5 |
4.9 |
4.1 |
|
2 |
5.9 |
2.3 |
5.2 |
2.9 |
4.2 |
4.4 |
5.2 |
2.5 |
3.8 |
2.6 |
5.9 |
2.5 |
4.2 |
4.4 |
|
4 |
2.7 |
3.6 |
5.5 |
0.69 |
2.6 |
4.7 |
1.7 |
1.2 |
3.9 |
0.8 |
2.7 |
4.2 |
2.3 |
4.7 |
|
7 |
3.9 |
2.9 |
3.3 |
3.8 |
4.3 |
2.3 |
4.8 |
3.6 |
3.9 |
3.2 |
4.8 |
3.6 |
3.8 |
3.7 |
|
11 |
4.31 |
2.28 |
4.60 |
2.75 |
4.97 |
5.13 |
4.63 |
2.72 |
3.47 |
2.86 |
4.63 |
2.72 |
4.97 |
5.13 |
|
13 |
3.94 |
2.34 |
3.28 |
3.63 |
4.34 |
3.44 |
4.84 |
3.63 |
3.88 |
3.22 |
4.84 |
3.63 |
3.78 |
3.69 |
|
14 |
4.66 |
1.75 |
3.88 |
1.25 |
4.66 |
4.09 |
4.72 |
1.31 |
2.44 |
1.03 |
4.66 |
1.25 |
4.72 |
4.09 |
|
16 |
4.00 |
4.28 |
4.75 |
3.88 |
4.66 |
2.78 |
3.53 |
3.75 |
3.21 |
2.75 |
4.66 |
3.75 |
4.88 |
4.81 |
|
17 |
4.94 |
2.38 |
5.19 |
2.31 |
5.13 |
2.38 |
4.94 |
1.38 |
3.81 |
2.44 |
4.56 |
2.56 |
4.88 |
1.00 |
|
18 |
5.47 |
1.25 |
5.66 |
1.94 |
4.41 |
2.28 |
5.66 |
1.94 |
4.94 |
1.28 |
5.34 |
1.94 |
5.59 |
3.28 |
|
20 |
5.59 |
3.84 |
5.72 |
2.75 |
5.03 |
2.34 |
5.69 |
2.75 |
5.31 |
2.41 |
5.69 |
2.34 |
5.31 |
5.01 |
|
23 |
4.97 |
5.38 |
5.41 |
3.13 |
5.44 |
5.38 |
5.84 |
1.78 |
4.66 |
3.44 |
5.84 |
5.38 |
5.81 |
1.59 |
|
25 |
2.81 |
4.28 |
2.88 |
3.13 |
5.63 |
4.63 |
2.81 |
3.13 |
4.72 |
4.09 |
5.63 |
4.63 |
2.91 |
3.03 |
|
27 |
5.09 |
3.44 |
4.25 |
4.59 |
4.75 |
2.59 |
3.94 |
3.81 |
5.63 |
4.34 |
4.38 |
3.81 |
3.75 |
4.06 |
|
30 |
3.69 |
2.69 |
5.00 |
2.19 |
5.31 |
2.69 |
5.13 |
2.19 |
2.94 |
0.88 |
5.13 |
2.50 |
.38 |
0.81 |
Table4. This Table shows the effect of the maximum MPFD in real and sham stimulations for each of the 15 (out of the 30) patients:1,2,4,7,11,13,14,16,17,18,20,23,25,27 and 30,according to the order of stimulation(run2 sham or run3 sham) in Table 1 . (in this Table in the first column P is for the patient number, in the other columns the RT is for the right temporal brain region, the LT for the Left temporal region, the RP is for the right parietal region, the LP is for the left parietal region, the F is for the frontal region, the V is for the vertex region and the O for the occipital brain region
|
P |
RT |
RT |
LT |
LT |
RP |
RP |
LP |
LP |
F |
F |
V |
V |
O |
O |
|
3 |
4.9 |
1.9 |
5.5 |
2.9 |
5.6 |
2.8 |
4.6 |
3.8 |
5.1 |
2.7 |
4.5 |
1.9 |
5.6 |
3.8 |
|
5 |
5.5 |
4.3 |
5.1 |
3.50 |
4.6 |
4.3 |
3.6 |
3.8 |
2.8 |
4.3 |
5.5 |
2.1 |
3.3 |
1.8 |
|
6 |
2.1 |
3.5 |
1.9 |
0.4 |
2.3 |
3.1 |
1.1 |
3.8 |
2.6 |
2.3 |
2.0 |
3.8 |
2.3 |
3.1 |
|
8 |
5.0 |
1.1 |
5.1 |
2.9 |
5.4 |
1.2 |
5.3 |
3.1 |
5.4 |
2.0 |
3.4 |
3.1 |
5.4 |
1.9 |
|
9 |
5.6 |
4.1 |
4.1 |
1.3 |
4.7 |
2.9 |
4.1 |
3.4 |
3.1 |
2.9 |
4.7 |
3.4 |
3.3 |
2.9 |
|
10 |
4.2 |
2.6 |
5.0 |
1.7 |
5.3 |
4.1 |
5.0 |
1.9 |
4.3 |
1.3 |
4.1 |
1.9 |
5.3 |
2.2 |
|
12 |
2.75 |
5.22 |
3.56 |
3.94 |
3.69 |
4.50 |
2.34 |
4.69 |
2.47 |
4.81 |
2.75 |
4.69 |
3.69 |
5.00 |
|
15 |
5.22 |
4.69 |
2.28 |
5.44 |
4.71 |
4.06 |
2.28 |
5.44 |
3.84 |
4.69 |
4.72 |
5.13 |
2.28 |
5.41 |
|
19 |
4.81 |
5.13 |
2.94 |
5.44 |
4.81 |
5.31 |
2.94 |
5.44 |
3.00 |
3.06 |
3.44 |
5.00 |
3.88 |
5.31 |
|
21 |
2.38 |
5.44 |
5.44 |
5.25 |
2.38 |
4.88 |
5.44 |
5.06 |
1.00 |
5.19 |
5.44 |
5.06 |
3.78 |
5.31 |
|
22 |
1.50 |
5.25 |
0.50 |
5.06 |
1.50 |
4.63 |
1.13 |
4.75 |
0.63 |
4.94 |
1.50 |
4.75 |
1.31 |
4.75 |
|
24 |
3.47 |
5.13 |
2.031 |
5.47 |
1.56 |
5.31 |
2.34 |
5.66 |
2.03 |
4.81 |
2.34 |
5.66 |
1.91 |
5.56 |
|
26 |
3.38 |
5.19 |
4.38 |
3.25 |
3.38 |
5.19 |
4.47 |
2.53 |
3.72 |
4.22 |
4.47 |
5.19 |
3.16 |
3.19 |
|
28 |
3.81 |
4.81 |
2.75 |
3.93 |
3.81 |
5.00 |
2.38 |
4.44 |
2.38 |
3.44 |
3.81 |
4.44 |
2.38 |
5.00 |
|
29 |
1.50 |
5.25 |
0.50 |
4.94 |
1.50 |
4.63 |
1.13 |
4.75 |
0.63 |
4.94 |
1.50 |
4.63 |
1.31 |
4.69 |
Table5. This Table is shown the effect of the maximum MPFD in real and sham stimulations for each of the 15(out the 30) patients:3,5,6,9,10, 12,15,19,21,22,24,26,28 and 29, according to the order of stimulation(run2 sham or run3 sham) in Table 1 . (in this Table in the first column P is for the patient number, in the other columns the RT is for the right temporal brain region, the LT for the Left temporal region, the RP is for the right parietal region, the LP is for the left parietal region, the F is for the frontal region, the V is for the vertex region and the O for the occipital brain region
|
Patients |
RUN2(REAL) |
RUN3(SHAM) |
Unpaired t-test |
|
1 |
4.55± 0.59 |
3.61 ±0.96 |
0.048 |
|
2 |
4.91± 0.85 |
3.08 ±0.91 |
0.002 |
|
4 |
3.05 ±1.26 |
2.84 ±1.86 |
0.80 |
|
7 |
4.11± 0.55 |
3.30 ±0.54 |
0.016 |
|
11 |
4.54± 0.55 |
3.37 ±1.21 |
0.041 |
|
13 |
4.16± 0.62 |
3.36 ±0.48 |
0.020 |
|
14 |
4.18± 0.91 |
2.11 ±1.36 |
0.004 |
|
16 |
4.28 ±0.71 |
3.71± 0.74 |
0.19 |
|
17 |
4.75± 0.51 |
2.06 ±0.61 |
0.0001 |
|
18 |
5.26 ±0.50 |
1.98 ±0.68 |
0.0001 |
|
20 |
5.45 ±0.28 |
3.06 ±1 |
0.0001 |
|
23 |
5.50± 0.45 |
3.72± 1.68 |
0.024 |
|
25 |
4.09 ±1.38 |
3.84 ±0.72 |
0.91 |
|
27 |
4.45± 0.67 |
3.80± 0.65 |
0.059 |
|
30 |
3.98 ±1.97 |
1.99± 0.81 |
0.023 |
Table6. Statistical analysis for the 15 patients of Table 4. The results are statistical significant at the level of 0.05 (marked bold). The mean and standard deviation (SD) for each patient includes the values of Table 5 for the 7 brain regions (RT , LT , RP , LP , F , V , O).
|
Patients |
RUN3(REAL) |
RUN2(SHAM) |
Unpaired t-test |
|
3 |
5.11± 0.46 |
2.82± 0.77 |
0.0001 |
|
5 |
4.34± 1.10 |
3.44 ± 1.06 |
0.15 |
|
6 |
2.04± 0.47 |
2.85± 1.20 |
0.12 |
|
8 |
5± 0.72 |
2.18± 0.86 |
0.0001 |
|
9 |
4.22± 0.86 |
2.98± 0.86 |
0.02 |
|
10 |
4.74± 0.52 |
2.24 ± 0.91 |
0.0001 |
|
12 |
3.03± 0.59 |
4.69 ± 0.40 |
0.0001 |
|
15 |
3.61 ± 1.31 |
4.98 ± 0.52 |
0.026 |
|
19 |
3.68 ± 0.83 |
4.95± 0.85 |
0.016 |
|
21 |
3.69 ± 1.81 |
5.17± 0.18 |
0.054 |
|
22 |
1.15± 0.42 |
4.87 ± 0.21 |
0.0001 |
|
24 |
2.24 ± 0.60 |
5.37± 0.31 |
0.0001 |
|
26 |
3.85± 0.57 |
4.10 ± 1.12 |
0.60 |
|
28 |
3.04 ± 0.72 |
4.43± 0.58 |
0.0019 |
|
29 |
1.15 ± 0.42 |
4.83± 0.22 |
0.0001 |
Table7. Statistical analysis for the 15 patients of Table 5. The results are statistical significant at the level of 0.05 (marked bold). The mean and standard deviation (SD) for each patient includes the values of Table 6 for the 7 brain regions (RT, LT, RP , LP , F , V , O).
Discussion
In this study we set out to replicate the effects of the increased abnormal dominant frequencies of 2-7 Hz band due to the effect of the pT stimulation in a group of 30 migraine patients. We tried to do our MEG measurements so as to have the highest possible precision as stated before.
Troebinger et al. [17], used a double-blind experimental design with our pico Tesla electronic device [3] in order to look for an effect of pT-TMS in healthy subjects. After unblinding, they found no significant effect of an increase in the frequency range (2-7Hz) across the subject group. This was due to the fact that from the 14 healthy subjects that were involved in their study only 8 were characterized with abnormal frequencies (2-7 Hz) and had the effect of pT-TMS.
Our experimental design was double-blind and our predictions were based on the true order of stimulation and on the MPFD in the data. After unblinding it was found the order of stimulation in 29 out of 30 patients was correctly predicted. Then, we thought it would be interesting to look for more substantial effects in different brain regions of the migraine patients, as explained in Tables 4,5.
Examination in the following day with the MEG shows that their spectrum was almost like normal with most of the high abnormal frequencies in the 2-7Hz frequency band being absent. All the migraine patients were evaluated clinically and with the MEG once again after one week after the first application of the pT-TMS in our laboratory. Most of the patients reported that they progressively deteriorated to their pretreatment status. To ascertain if the responses elicited in our lab were reproducible, the patients were advised to apply nightly at (23.00 pm) the pT-TMS treatment at home with the electronic device mentioned before in the methods. After this all the migraine patients were evaluated again and they all reported to have benefited from this treatment. The mechanisms by which the application of the pT-TMS attenuated the migraine patient's syndrome are unknown. However one possible explanation is that these magnetic fields have been shown to influence the activity of the pineal gland (PG) which regulates the endogenous opioid functions [18] and the dopaminergic modulator [19], GABA [20,21]. Moreover on the cellular level, magnetic fields have been shown to influence the properties and stability of biological membranes as well as their transport characteristics including the intra and extracellular distributions and flux of calcium ions [16]. Two patents demonstrated the role of pineal gland after pT-TMS [22,23]. Anninou and Tsagas patent [22] revealed the strengthening of the immune system which is controlled by the PG. Anninos et al., patent [23] demonstrated the decalcification of epiphysis using magnetic fields with characteristics determined by MEG and our pT-TMS electronic device.
Conclusion
Therefore, it is possible to conclude that this method of the pT-TMS has some potential to be an important non invasive, safe and efficacious modality in the management of idiopathic migraine patients. However, further investigations are necessary with more subjects using this method of pT-TMS in order to evaluate its possible beneficial contribution for managing the symptoms of idiopathic migraine patients.
Source of funding
Funding for this work was provided by a collaboration of GGET (General Secretariat of Research and Technology, GR) and ERGO AEBE, INC, GR under the research program titled "Foundation of a Laboratories Network and purchase of a Multichannel Biomagnetometer SQUID (Superconducting Quantum Interference Device), in order to develop an expert system for automatic acquisition, analysis, evaluation and exploitation of MEG signals that are emitted from different organs of the human body" (Grant Number: 80623).
Conflict of interest
None
References
- Barker AT, Jalinous R, Freeston IL (1985) Non-invasive magnetic stimulation of human motor cortex.Lancet 1: 1106-1107.
- Klein MM, Treister R, Raij T, Pascual-Leone A, Park L, et al. (2015) Transcranial magnetic stimulation of the brain: guidelines for pain treatment research. Pain 156: 1601-1614.
- Anninos PA, Tsagas N (1995) Electronic apparatus for treating epileptic individuals, USA patent 5453072.
- Anninos P, Adamopoulos A, Kotini A, Tsagas N, Tamiolakis D, et al. (2007) MEG evaluation of Parkinson's diseased patients after external magnetic stimulation. Acta Neurol Belg 107:5-10.
- Anninos P, Kotini A, Tamiolakis D, Tsagas N (2006) Transcranial magnetic stimulation. A case report and review of the literature. Acta Neurol Belg 106: 26-30.
- Anninos P,Kotini A, Adamopoulos A, Tsagas N (2003) Magnetic stimulation can modulate seizures in epileptic patients. Brain Topogr 16: 57-64.
- Anninos P, Kotini A, Anninou N, Adamopoulos A, Papastergiou A, et al. (2008) Meg recordings of patients with CNS disorders before and after external magnetic stimulation. J Integr Neurosci 7: 17-27.
- Anninos P, Kotini A, Tamiolakis D, Prassopoulos P (2007) Evaluation of an intracranial arachnoid cyst with MEG after magnetic stimulation. J Integr Neurosci 6: 227-232.
- Anninos PA, Adamopoulos AV, Kotini A, Tsagas N (2000) Nonlinear analysis of brain activity in magnetic influenced Parkinson patients. Brain Topogr 13: 135-144.
- Anninos PA, Beek B, Csermely TJ, Harth EM, Pertile G (1970) Dynamics of neural structures. J Theor Biol 26: 121-148.
- Anninos PA, Tsagas N, Adamopoulos A (1989) A brain model theory for epilepsy and the mechanism for treatment with experimental verification using SQUID measurements. In: Cotterill RM, editors. Models of brain function. New York: Cambridge University Press, 405.
- Anninos PA, Tsagas N, Jacobson JI, Kotini A (1999) The biological effects of magnetic stimulation in epileptic patients. Panminerva Med 41: 207-215.
- Anninos PA, Tsagas N, Sandyk R, Derpapas K (1991) Magnetic stimulation in the treatment of partial seizures. Int J Neurosci 60: 141-171.
- John ER (1967) Mechanisms of memory in representational systems. New York: Academic Press.
- Kaczmarek LK, Adey WR (1974) Weak electric gradients change ionic and transmitter fluxes in cortex. Brain Res 66: 537-540.
- Ossenkopp KP, Cain DP (1988) Inhibitory effects of acute exposure to low intensity 60Hz magnetic fields on electrically kindled seizures in rats. Brain Res 442: 255-260.
- Troebinger L, Anninos P, Barnes G (2015) Neuromagnetic effects of pico-Tesla stimulation. Physiol Meas 36: 1901-1912.
- Lissoni P, Esposti D, Esposti G, Mauri R, Resentini M, et al. (1986) A clinical study on the relationship between the pineal gland and the opioid system. J Neural Transm 65: 63-73.
- Brandbury AJ, Kelly ME, Smith JA (1985) Melatonin action in the mid-brain can regulate dopamine function both behaviourally and biochemically. In: Brown GM, Wainwright SD ,editors. The Pineal gland, endocrine aspects. Oxford: Pergamon Press 327-332.
- Nitsche MA, Lampe C, Antal A, Liebetanz D, Lang N, et al. (2006) Dopaminergic modulation of long-lasting direct current-induced cortical excitability changes in the human motor cortex. Eur J Neurosci 23: 1651-1657.
- Anton-Tay F. (1974) Melatonin, effects on brain function. Adv Biochem Psychopharmacol 11: 315-324.
- Anninou N, Tsagas I. Electronic device for strengthening the immune system .USA patent 20060058572 A1/March 16 ,2006.
- Anninos P, Tsagas N, Papastergiou A (1999) Decalcification of epiphysis with the use of magnetic fields with characteristics determined by biomagnetometron SQUID and an electronic device that produces the magnetic fields. GR Patent Nο 1003262/Nov 19.