Volodymyr Ivanov1*, Saeid Rezaeinejad1, and Olena Stabnikova1
1School of Civil and Environmental Engineering, Nanyang Technological University, Singapore
Corresponding author
2014 Dr. Volodymyr Ivanov. This is an Open Access article published and distributed under the terms of the Creative Commons Attribution License, which permits unrestricted use, distribution and reproduction in any medium, provided the original author and source are credited.
Received Date: 29thOctober 2014
Accepted Date: 18th November 2014
Published Date: 21st November 2014
Citation
Ivanov V, Rezaeinejad S, Stabnikova O (2014) Physiological Dualism of Eukaryotic Cell: Simultaneous Presence of Exotrophic and Endotrophic Cells in Growing Population of Saccharomyces cerevisiae. Enliven: Microb Microbial Tech 1(1): 003
Copyright
@ 2014 Dr. Volodymyr Ivanov. This is an Open Access article published and distributed under the terms of the Creative Commons Attribution License, which permits unrestricted use, distribution and reproduction in any medium, provided the original author and source are credited.
Abstract
This paper describes the physiological dualism of yeast cells during their exponential growth and the method to detect and measure the subpopulations in such alternative physiological states of cell as exotrophy or endotrophy, which are the consumptions of either extracellular or intracellular, previously accumulated sources of energy, respectively. All cells of Saccharomyces cerevisiae population growing in the medium with glucose had low alcoholdehydrogenase (ADH) activity. Meanwhile, the population growing in the medium with ethanol as a source of energy contained cells with either high ADH activity (ADH-H cells) or low ADH activity (ADH-L cells). Physiological heterogeneity of yeast cells by activity of alcoholdehydrogenase was studied using selective killing of cells with high ADH activity after 10 min incubation of cells in 1% (v/v) solution of allyl alcohol. The content of ADH-H cells increased from zero in the lag-phase to 32% in the exponential phase of batch culture and then dropped to zero in the stationary phase. Presence of both ADH-H and ADH-L cells in the yeast population growing in the medium with ethanol was explained that ADH-H cells actively oxidize external ethanol but ADH-L cells oxidize intracellular storage of carbohydrates without involvement of ADH. The method for enumeration of exotrophic and endotrophic cells can be used to monitor the heterogeneity of yeast populations consuming ethanol as a source of energy.
Keywords
Saccharomyces cerevisiae; Flow cytometry; Exotrophic cells; Endotrophic cells; Alcohol dehydrogenase
Introduction
It is well known fact that a growing isogenic microbial population always contains cells with the different levels of physiological activities. It is due to the physiological changes during the cell and life cycles [1-6] or because of spatial heterogeneity and existence of micro-gradients of nutrients and metabolites in a population [7-9]. The physiological changes in the mitotic cell cycle and an existence of sub-populations with different physiological properties are well known for the growing populations of suspended yeast cells [5,6,10,11]. The biggest changes of metabolism in the eukaryotic cell cycle occur at the transitions from G1- to S-phase and from G2-phase to mitosis, the two most important cell cycle check points [12], due to the functioning of different whole-cell oscillators [13-14]. Therefore, sub-populations of cells with different values of some physiological parameters varying from zero to maximum value can be detected in the growing cell populations [15-17].
There is also diversity among yeast cells of one population in survivability upon exposure to stress or starvation [18–20]. This is especially important for industrial, medical, environmental, and food microbiology because a small fraction of population can survive after the treatment that kills the majority of the population. The difference of cells in survivability is probably due to the presence of some portion of cells with low or zero metabolic activity in such abiotic forms of life cycle as spores, cysts, and dormant cells [18]. The persistent forms of yeast cells are a small fraction of the exponentially growing population (due to carry over from the inoculum) but induced typically by an exposure of yeast to nutrient starvation or physicochemical stresses [19-20].
Ethanol is produced on a large scale by chemical and biotechnological industries as a chemical commodity and a biofuel. Therefore, it is used in biotechnology as a cheap and pure raw material for biosynthesis of enzymes, single cell protein, lipids, organic acids, and esters [21-28]. The key enzyme for the oxidation of ethanol is alcohol dehydrogenase (ADH, EC 1.1.1.1) [29,30]. Solution of allyl alcohol is often used for the selection of microbial strains without ADH activity (adh- mutants) for different kind of genetic studies because cells with high activity of cytoplasmic ADH oxidize not only ethanol but also allyl alcohol thus producing toxic allyl aldehyde killing these cells [31-33]. We used similar approach, i.e. short term-incubation of cells in the solution with the low concentration of allyl alcohol, to discriminate and enumerate cells with phenotypically high and low activity of ADH.
The aim of this research was to study the distribution of ADH activity in the population of yeast cells growing in the medium with ethanol as a source of energy.
Materials and Methods
Microorganism, Cultivation Medium and Growth Conditions
The yeast strain of Saccharomyces cerevisiae DSMZ 70449 was grown either in the medium with ethanol as a source of energy, 4 g/L, and yeast extract, 3 g/L (Sigma-Aldrich®) or in the YMPG (Yeast Malt Glucose Peptone) broth (Difco™, Becton Dickinson, Sparks, MD, USA) with glucose as a source of energy. Media were sterilized by membrane filtration using cellulose nitrate membrane with 0.2 µm pores (Sartorius AG, Goettingen, Germany). Air-permeable silicone rubber plug C-type for Erlenmeyer flasks have been used to ensure aseptic filtration. Cells were grown in 100 mL of the medium in 500 mL Erlenmeyer flasks (Schott Duran, Germany) placed in the shaker incubator at 200 rpm at 30ºC. Inoculum was 3 days culture produced in same medium after inoculation with cells from one colony of pure culture of Saccharomyces cerevisiae DSMZ 70449 grown on YMPG broth solidified with agar, 20 g/L. The phases of batch culture were determined by optical density of cell suspension at 600 nm using the spectrophotometer DU 640B (Beckman Coulter, USA). The exponential phase of batch culture was during a period from 11 to 24 h of cultivation.
Respiration Rate Measurement
CO2 production rate was measured using the respirometer (Columbus Oxymax ER, OH, USA) connected with 50 mL sample of yeast cells that was placed in 100 mL DURAN® cylindrical culture bottles (Schott, NY, USA) in the shaker incubator at 200 rpm at 37ºC. The bottle was connected to the respirometer and continuously aerated with air flow 100 mL/min so that air retention time in gas space was 0.5 min.
Starvation Experiments
For experiments on starvation, 10 mL of cells were washed twice with phosphate buffered saline (PBS) (NaCl, 8.0 g/L; KCl, 0.2 g/L; Na2HPO4, 1.44 g/L; KH2PO4, 0.24 g/L; pH 7.4) using centrifugation for 10 min at 3400×g. The pellet was re-suspended in 10 mL of PBS and incubated in the shaker at 25°C for 2.5 h. The samples were taken every 30 min for the 10 min treatment in 1% (v/v) solution of allyl alcohol following by flow cytometry.
Discrimination of Cells with High and Extremely Low ADH Activity
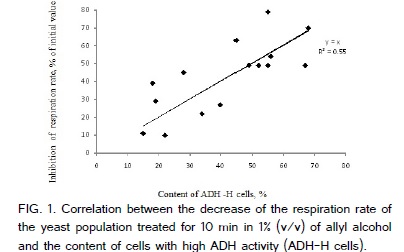
Cells with high activity of cytoplasmic ADH alcohol dehydrogenase (ADH, EC 1.1.1.1) can also oxidize allyl alcohol thus producing intracellular toxic acrolein (allyl aldehyde). Therefore, a short term incubation of cells in 0.5 - 1.0 % (v/v) solution of allyl alcohol was often used for the selection of microbial strains without ADH activity [31- 33]. The same approach was used in this study. The respiration rate of yeast cells growing in the medium with ethanol as a source of carbon and energy dropped after addition of 1% (v/v, final concentration) of allyl alcohol but after 10 min of incubation the respiration rate stabilized assuming that there is a subpopulation of cells with a low cytoplasmic ADH activity, which do not produce the toxic allyl aldehyde and thus stay alive (Figure1) .
That is why 10 min treatment in 1% (v/v) solution of allyl alcohol was used to kill cells with high ADH activity (ADH-H cells). Dead ADH-H cells after 10 min incubation with 1% (v/v) solution of allyl alcohol were detected using flow cytometry after staining the cells with propidium iodide (PI), which is a common indicator of dead cells [17,34-36]. Propidium iodide is often used as an indicator of dead microbial cells because the staining of chromosomal DNA and part of rRNA with PI through intercalation is possible only when a cell membrane in a dead cell lost its integrity and became permeable for molecules of PI. An aliquote of 1 mL of growing cell culture was mixed with 10 µL of allyl alcohol (final concentration was 1% (v/v) = 147 mM), in 10 mL tube and incubated in the shaker at 200 rpm at 25oC for 10 min. In control, addition of ally alcohol was 200 µL (final concentration of allyl alcohol was 20% v/v) to kill all cells in the population. After incubation, cells were washed twice with membrane-filtrated phosphate buffered saline (PBS) (pH 7.2) using centrifugation for 10 min at 3400×g. The pellet was re-suspended in PBS and then stained with 1 µL of the mixture LIVE/DEAD BacLight™ viability kit, containing membrane-permeable nucleic acids stain SYTO9, 3.34 mM, and propidium iodide (PI), 20 mM (Molecular Probes, Invitrogen, Eugene, Oregon). Staining was performed in the dark for 20 min at 25oC and cells were washed with PBS twice using centrifugation at 3400×g for 10 min and then were re-suspended in 1 mL of PBS for flow cytometry. Yeast cells were detected by either forward scattering of light or by green fluorescence of SYTO9 stain (Molecular Probes, Invitrogen, Eugene, Oregon, USA) for nucleic acids. The flow cytometry gate for double stained dead cells, shown as R1 of dot plot in Figure.2, was selected using cells killed in 20% (v/v) solution of allyl alcohol.
Discrimination of Respiring Cells from Non-Respiring Ones
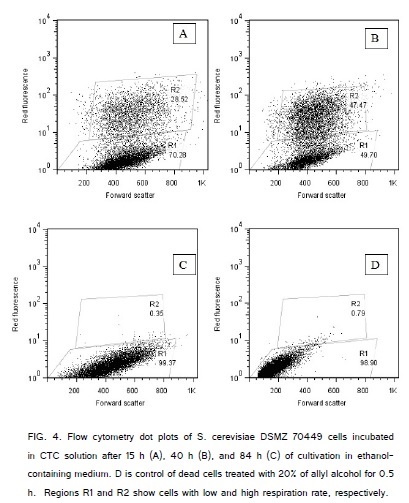
The way to determine individual cell respiration rate through integrated activity of numerous intracellular dehydrogenases was an incubation of cells in the solution of 5-cyano-2,3-ditolyl tetrazolium chloride (CTC), which is reducing by the variety of dehydrogenases forming a water-insoluble intracellular formazan having red fluorescence [34,35,37,38]. CTC is often used as an indicator of cell respiratory activity in combination with flow cytometry [34,35,39]. In our experiments, an aliquot of 100 µL of the stock solution (50 mM) of CTC (Polyscience, Inc., Warrington, PA, USA) was added to a test tube containing 900 µL of sample and incubated for 1 h at 30ºC under agitation at 200 rpm. The final concentration of CTC was 5 mM. Red fluorescence of cells increased when formazan, product of CTC reduction by dehydrogenases, was accumulated in cell. In control, addition of ally alcohol was 200 µL (final concentration of allyl alcohol was 20% v/v) to kill all cells and stop their respiration. The flow cytometry gates for CTC-stained non-respiring cells is a quadrant of low red fluorescence, which is defined in control, where cells were killed in 20% (v/v) solution of allyl alcohol.
Flow Cytometry and Counting Analysis of Cell Population
Flow cytometry analysis was performed using Becton Dickinson (BD) FACSCalibur™ flow cytometer with CELLQuest™ software for data acquisition. A total of 50,000 cells were counted, based on 488 nm excitation by 15 mW air cooled, blue argon ion laser. Green fluorescence of SYTO9 was measured using a short pass filter 530 ± 15 nm, and red fluorescence of PI was measured using a band pass filter 620 ± 10 nm. The sheath flow rate was 10 mL/min. The sample analysis rate was below 1,000 events/s. Flow cytometry data were analysed using FlowJo V.7.2.5 software (www.flowjo.com). Digital images were produced using Fluoview300 confocal laser scanning microscope (Olympus, Japan). Red fluorescence of PI were excited by a 10 mW or 40 mW argon ion laser at 488 nm, separated with a 570 nm splitting filter and detected in the channel 1 with the longpass filter 510 nm (or the band pass filter 525 - 575 nm) and in the channel 2 with the bandpass filter 580 - 640 nm (or the bandpass filter 595 - 645 nm). The same gating strategy has been used for all data files: cells treated with 20% (v/v) solution of allyl alcohol formed the region R1 to detect dead cells by red fluorescence of PI.
The content of non-budded yeast cells in population was counted manually for 300 - 500 cells under light microscope.
Results
Effect of 10-min Incubation of Cells in 1% Solution of Allyl Alcohol on Respiration Rate of S. cerevisiae DSMZ 70449
The respiration rate of yeast cells growing in the YMPG medium with glucose as a source of energy did not change after 10 min treatment in 1% (v/v) of allyl alcohol and diminished to 82% of initial value only after 1 h treatment. Meanwhile, the respiration rate of yeast cells growing in the medium with ethanol as a source of energy was diminished to 28% of initial value after 10 min of the treatment with 1% (v/v/, final concentration) of allyl alcohol and then did not changed but was stable for at least 1 h. The decrease of the respiration rate after 10 min treatment in 1% (v/v) of allyl alcohol of the samples taken at the different time of cultivation from the medium with ethanol positively but weakly correlated with the content of cells of high ADH activity (i.e. cells killed by the treatment in 1% (v/v) of allyl alcohol). Correlation coefficient was +0.76 (Figure.1). It shows that the correlation between the drop in the respiration rate of the population after 10 min treatment in 1% (v/v) of allyl alcohol and percentage of cells with high ADH activity (ADH-H cells) is positive one but weak. The reason of a weak correlation could be a phase shift between the maxima of respiration rate and ADH activity of cell during cell cycle (see "Discussion").
Effect of 10-Min Incubation of Cells of S. cerevisiae DSMZ 70449 in 1% (V/V) Solution of Allyl Alcohol on Cell Dying
The cells of the population of S. cerevisiae DSMZ 70449, which exponentially grew in the medium with glucose as a source of energy, were not sensitive to 10 min treatment in 1% (v/v) solution of allyl alcohol. So, cells grown on the medium with glucose had negligibly low alcohol dehydrogenase activity (ADH-L cells). Meanwhile, in the population that was exponentially growing in the medium with ethanol as a source of energy some cells were sensitive to 10 min incubation in 1% (v/v) solution of allyl alcohol (ADH-H cells) and some cells were not sensitive to this treatment (ADH-L cells). The example of typical flow cytometry dot plot distributions of ADH-H cells and ADH-L cells is shown in Figure. 2.
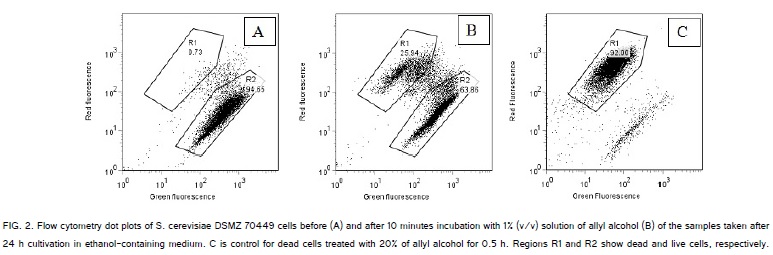
On the flow cytometry dot plots of Figure.2 about 95% of cells were alive (Figure. 2a), but after 10 min incubation in 1% (v/v) solution of allyl alcohol the content of alive cells diminished to about 64% (Figure.2b). The difference between the cell contents in region R2 before and after incubation in 1% (v/v) solution of allyl alcohol is the content of ADH-H cells. For example shown in Figure. 2, the population of S. cerevisiae DSMZ 70449 cells in the exponential phase of batch culture (24 h of cultivation) contained 28 ± 3 % of ADH-H cells (average ± standard deviation, 3 independent measurements). Membranes of stressed cells of S. cerevisiae are also permeable to propidium iodide [40], so killed ADH-H cells were detected also by staining with respiratory indicator CTC and membrane potential indicator DiBAC(4) [6]. The content of dead cells in control (i.e. cells before treatment with allyl alcohol solution) was 1 - 3% of population during 15 - 24 h of batch cultivation.
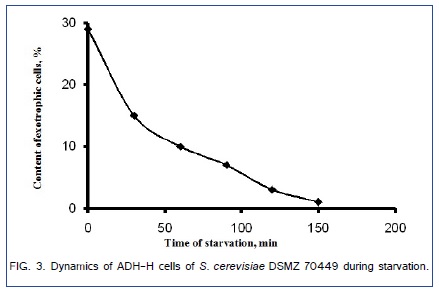
The content of ADH-L cells is shown in the region R2 of the dot plot in Figure.2b. In the samples from the exponential phase of batch culture (24 h of cultivation) the content of cells that survived after 10 min-treatment in 1% (v/v) solution of allyl alcohol was about 66 ± 3% of (average ± standard deviation, 3 independent measurements). The contents of ADH-H cells in the samples, taken during batch cultivation, changed from 0% in the lag-phase to 33% in the exponential phase and then dropped to 0% in the stationary phase. Artificial starvation of the sample of cell suspension taken from the exponential phase of batch culture reduced the content of ADH-H cells from 29% to 1% during 2.5 h of starvation (Figure.3).
Respiring and Live Non-Respiring Cells in the Exponentially Growing Population of S. cerevisiae DSMZ 70449
The way to determine integrated activity of numerous intracellular dehydrogenases in cell is incubation of cells with the solution of 5-cyano-2,3-ditolyl tetrazolium chloride (CTC) [38]. This tetrazolium dye is reduced by the variety of dehydrogenases forming a water-insoluble red fluorescent intracellular formazan [35]. The reduction of CTC in cell is considered as an indicator of active cell respiration [35,41]. There were subpopulations of actively respiring cells (CTC-H) and slow respiring (or not respiring) cells (CTC-L) in the population of S. cerevisiae DSMZ 70449 grown in the medium with ethanol (Figure.4).
Correlation coefficient between the contents of cells with active alcoholdehydrogenase (ADH-H cells) and the contents of cell with high total activity of intracellular dehydrogenases (CTC-H) cells during batch culture was +0.94 (Figure. 5).
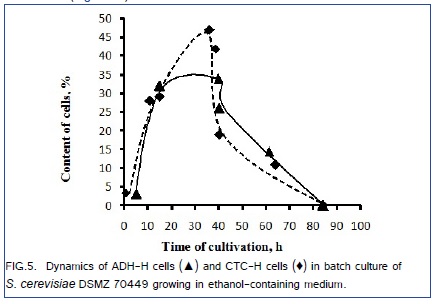
Therefore, actively oxidizing ethanol ADH-H cells and actively respiring CTC-H cells belong probably to the physiologically same subpopulations. Two subpopulations, actively respiring (CTC-H) cells and alive but not-respiring (CTC-L) cells are simultaneously present in the yeast population during its exponential growth (Figure.4) similar to the simultaneous presence of subpopulations of ADH-H and ADH-L cells in the yeast population (Figure.2).
Discussion
Experimental data can be used for the verification of several hypothesis on the origin and function of the simultaneous existence of subpopulations of cells with high and low ADH activities in the population growing in the medium with ethanol.
Hypothesis 1. ADH-H Cells are Actively Growing Cells While ADH-L Cells are “The Persisters”
Numerous flow cytometry, microbiological, and molecular-biological studies demonstrated that even isogenic microbial population contains many different subpopulations [4,17,42,43].The fraction of yeast population, ADH-L cells, that was grown in the medium with ethanol and is resistant to 10 min incubation in 1% (v/v) of allyl alcohol could be considered at a first look as ”survivors”, i.e. cells of population that survive upon exposure to stress, starvation, or antibiotics , and are accumulating in population by exposure of cells to nutrient starvation or stress [18-20]. ADH-L cells were also accumulated in our experiments in the exponential phase of batch culture or during artificial starvation. However, the “survivors” are usually dormant cells with slow or almost zero metabolism and their content in the exponentially growing population is low [18], while our data show that the content of ADH-L cells in the exponentially growing yeast population can be up to 68%. Some of ADH-L cells are actively respiring because maximum content of ADH-H cells is about 32%, while maximum of CTC-H cells is about 48%, so at least about 16% cells of exponentially growing population are ADH-L and at the same time actively respiring CTC-H cells .
So, yeast cells growing in the medium with ethanol and which remain alive after 10 min incubation with 1% (v/v) solution of allyl alcohol, defined as ADH-L cells, are not the “survivors”, i.e. dormant or abiotic forms of cells, but metabolically active cells,which are not sensitive to 10 min incubation with 1% (v/v) solution of allyl alcohol.
Hypothesis 2. ADH-L Cells are Slow-Respiring Cells
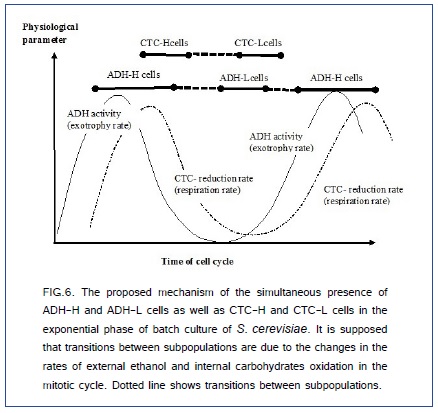
There are known also sub-populations of cells with the different respiration ratesdue to the changes of the respiration rate of yeast during the mitotic cycle [1,44,45]. Using a microwell array [46], it was shown a ten-fold difference in the oxygen consumption rate of individual cells in the growing isogenic cell population [4]. The difference in the respiration rates of ADH-H and ADH-L cells can explain partially the different sensitivities of cells to the incubation with 1% (v/v) solution of allyl alcohol. In this case, the lower respiration rate is accompanied with the lower production of toxic acrolein and the higher content of ADH-L cells. In our experiments, correlation coefficient between the contents of ADH-H and CTC-H cells was +0.94. The hypothetic change of ADH activity and CTC reduction-oxidation activity in the mitotic cycle, which explains partial correlation between the contents of ADH-H and CTC-H cells, is shown in Figure.6. However, it is not clear why ADH and respiration activities are changed during the mitotic cycle.
Hypothesis 3. ADH-L Cells Do not Oxidise External Ethanol but are Consuming Internal Storage of Carbohydrates
Probably, ADH-L cells are characterized by slow ADH oxidation of external ethanol in some phase of mitotic cycle. Their tolerance to 10 min incubation in 1% (v/v) solution of allyl alcohol can be explained partially by the decrease of the respiration rate but the main hypothetical explanation is that ADH-L cells consume not external ethanol but the internal storage of carbohydrates without involvement of ADH. The main reason for this explanation is that yeast cells oxidising glucose are resistant to 10 min incubation in 1% (v/v) solution of allyl alcohol, i.e. ADH activity is low or absent in cells during glucose oxidation. The mechanism of this change can be carbohydrate catabolite repression of the ADH gene, which is known from 1970s - 1980s for both prokaryotic and eukaryotic cells [47-50]. Glucose-repressed yeast ADH is cytoplasmic isoenzyme ADH-2 that has the highest affinity to ethanol among other ADH isoenzymes [29]. So, initiation of oxidation of intracellular storage of carbohydrates during the mitotic cycle can repress ADH synthesis and initiate deactivation of existing enzyme and oxidation of external ethanol as a consequence.
Dynamics of accumulation and usage of intracellular sources of carbon and energy during the cell cycle were studied from 1960s. It has been found previously that rapid degradation of such reserve carbohydrates as trehalose and glycogen is going in synchronized culture of S. cerevisiae at the beginning of budding [51,52], which corresponds to the beginning of Sphase (chromosomal DNA replication phase). The reason of these changes could be different catabolism of extracellular and intracellular sources of carbon and energy. It is known also that CO2 production rate and oxygen consumption rate were at minimum at the beginning of the budding in synchronized continuous culture of yeasts [53]. Basing on the relatively constant duration of the budding phase, that includes S, G2, and M phases of mitotic cycle, and variable duration of single-cell phase (it is G1 phase for growing populations) it was supposed that cell accumulates in G1 phase intracellular sources of carbon and energy sufficient for supply of carbon and energy for S, G2, and M phases of the mitotic cycle [45].Two subpopulations showing different ability to oxidize external glucose have been detected using the fluorescent glucose analogue 2-NBD glucose [16,54]. So, the transition from external consumption of ethanol to the consumption of the internal storage of carbohydrates could be used for an explanation of the differences between ADH-H and ADH-L cells. This hypothesis is close to the idea of Wang and Levin [55] on the changes of cell metabolism during the bacterial cell cycle. Basing on the relatively constant duration of both C-period and D-period and variable duration of B-period of the prokaryotic cell cycle, Wang and Levin [55] supposed that bacterial cell accumulates in B-period intracellular sources of carbon and energy that will be sufficient for supply of carbon and energy during DNA replication and cell division. This feature was considered as an adaptation to fluctuations of nutrients availability in natural ecosystems. For the yeasts, there are known different whole cell-cycle oscillators like cyclin-dependent protein kinases and their regulatory subunits [56-58]. Cyclin-dependent kinases are important in the temporal control of the cell cycle events but there are many other regulators mediated a temporal programme of genes expression during the cell cycle and cell metabolism [13,59,60]. Concentration of potassium and cell membrane potential could be also the whole oscillators of cell metabolism during the cell cycle [6]. There were shown also oscillations in the patterns of expression of a large fraction of yeast genes, which is intrinsic property of metabolism of individual yeast cells [61].
The physiological differences between ADH-H and ADH-L subpopulations could be due to the oscillation of ADH activity and catabolism of the external and internal sources of energy. We anticipate our results to be a starting point to reveal deeper differences between exotrophic and endotrophic subpopulations of growing cells.
Knowledge of physiological heterogeneity of the natural and industrial microbial populations with subpopulations of different biochemical activities, sensitivities to environmental factors, viability and culturability is essential in the studying, modelling and monitoring of microbial populations [41]. Analysis of physiological heterogeneity of natural or industrial microbial population is also an effective way to monitor and control its physiological changes [4,11]. So, the monitoring of ADH-H and ADH-L subpopulations could be useful in the studying and control of natural and industrial yeast populations growing in the medium with ethanol.
Acknowledgements
We are grateful to Mr. Kumaravel Kandaswamy for his technical assistance in the experimental performance. We acknowledge support from Nanyang Technological University, Singapore, where the major portion of the described research have been made and from Iowa State University, USA, where the major part of the paper has been written.
References
12. Morgan DO (2007) The cell cycle, principles of control. London: New Science Press.
35. Shapiro HM (2003) Practical Flow Cytometry. 4th ed Hoboken, John Wiley & Sons Inc.