Research Article
Micha? H. Jamróz
Institute of Nuclear Chemistry and Technology, 03-195 Warsaw, Poland
Corresponding author
Michal H. Jamroz, Institute of Nuclear Chemistry and Technology, 03-195 Warsaw, Poland, E-mail: micjam@wp.pl
Received Date: 06th November 2014
Accepted Date: 26th November 2014
Published Date: 28th November 2014
Citation
Jamróz MH (2014) On the Internal Coordinates in the Potential Energy Distribution (PED) Analysis: Bending or Torsion? Enliven: Bioinform 1(4): 006.
Copyright
@ 2014 Dr. Micha? H. Jamróz. This is an Open Access article published and distributed under the terms of the Creative Commons Attribution License, which permits unrestricted use, distribution and reproduction in any medium, provided the original author and source are credited.
Abstract
The discussion on the Potential Distribution Analysis (PED) and internal coordinate definitions are presented. The VEDA program written by the author, reads the input data automatically from the Gaussian program output files. Then, VEDA automatically proposes an introductory set of local mode coordinates. Next, the more adequate coordinates are proposed by the program and optimized to obtain maximal elements of each column (internal coordinate) of the PED matrix. In that way the theoretical spectrum become understandable in category of chemical structure elements: skeleton, bonding and functional groups. The final goal of the proper representation of the theoretical vibrational spectra is always to give possibility of the most accurate interpretation of the experimental spectra, what gives the chemist the desired knowledge. As VEDA program can manage with over 200 atoms – it can be useful for peptides/proteins spectra elucidation.
Keywords
PED; VEDA; Vibrational spectra; Interpretation; Theoretical spectra; Internal coordinates
Abstract
The discussion on the Potential Distribution Analysis (PED) and internal coordinate definitions are presented. The VEDA program written by the author, reads the input data automatically from the Gaussian program output files. Then, VEDA automatically proposes an introductory set of local mode coordinates. Next, the more adequate coordinates are proposed by the program and optimized to obtain maximal elements of each column (internal coordinate) of the PED matrix. In that way the theoretical spectrum become understandable in category of chemical structure elements: skeleton, bonding and functional groups. The final goal of the proper representation of the theoretical vibrational spectra is always to give possibility of the most accurate interpretation of the experimental spectra, what gives the chemist the desired knowledge. As VEDA program can manage with over 200 atoms – it can be useful for peptides/proteins spectra elucidation.
Introduction
PED Analysis
To describe the vibration of a N-atomic molecule (or a system of interacting molecules), the PED analysis require the construction of the set of 3N-6 local, linearly independent, internal coordinates, which represents stretching, bending and deformation motions of the functional groups or the chosen fragments of the molecule. The introduction of such a coordination set instead of the normal modes causes that the potential energy distribution matrix, the PED matrix, ceases to be diagonal, but the energy distribution originating from the motions of particular functional groups is understandable for the interpreter. In 1970 a software for the PED analysis was written by Balga, and later modified by Lapinski [1]. The software, however, requires that the user will define a coordination set manually. Meanwhile, even for 16-atomic molecule, the task is difficult, since it involves the introduction of 42 independent definitions of coordinates. For the 50-atomic molecules it is nearly impossible. The introduction of the automatic generation of the SBT (Stretching. Bending, Torsion) coordination set was one of the essential innovations in my software [2,3]. VEDA uses atoms connected with bonds in order to create the SBT coordinates. That is why the connectivity matrix is generated beforehand (.mpo file). For the N-atomic system the software creates in an unaffected way 3N-6 coordinates: N-1 S (Stretching) coordinates, N-2 B (Bending) coordinates and N-3 T (Torsion) coordinates.
The Origin and Development of the VEDA Software
In the late nineties I begun to construct the software, which automatically generate the set of local coordinates, i.e. the VEDA software. It was cited for the first time after its application in the analysis of a 9-atomic molecule [4]. Three years later it was used for more complicated systems, including a 66-atomic one [5]. Since then, the software has been developed by me and repeatedly applied. The advantage of the theoretical and experimental spectra effective comparison was proved by us, when we analysed many cysteine [6] and isoserine [7] conformers. The possibility for an automatic optimization of PED contributions is a unique feature of the VEDA program absent in any other programs performing PED analysis. The VEDA program is cited in literature over 250 times.
Recently it has been made accessible to the international scientific community. In the current basic edition of the software it is possible to analyse 120-atomic system, and in the expanded versions even 480-atomic (VEDAxx) ones. The software is accessible via Internet:http://www.smmg.pl [3].
Results and Discussion
SBT (stretch, bend, tors) coordination set vs. the normal modes [2,3]. For the description of the studied system vibrations, the VEDA software uses local coordinates defined in a following manner: 'stretching' S, 'bending' B and 'torsion or/and out-of-plane' T. The definition of the S coordinate requires the indication of two atoms A-B, the B definition – three atoms A-B-C and the T definition – four atoms A-B-C-D. The S coordinate describes two-atomic stretching motion, B – motion in the ABC plane and T – the change in the value of torsion angle between ABD and BCD lanes (torsion) or the AD vector deflection from the ABC plane (out-of-plane). These definitions are in accordance with those in the Balga software [1].
Let’s regard 4 atomic non-planar molecule fragment. Atom 1 has two deformation modes, in the two planes perpendicular to 2-3-4 plane: one contain 1-2 bond, and the second is perpendicular to it (Figure 1).
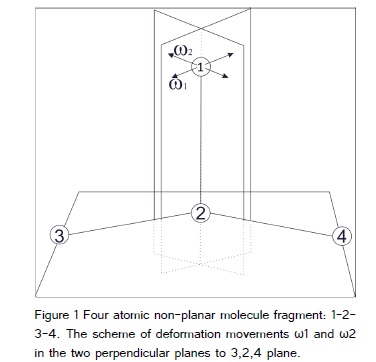
In the paper [8] we considered the structures that contain such a fragment. We concluded that the best coordinates describing above movements are the difference and sum of the torsions: 1-2-3-4 and 1-2-4-3. Some researchers believe that the best way of the describing the above movements is the using of sum and differences of the bendings 1-2-3 and 1-2-4, respectively and call that movements: “bendings”. It is not true: there not exist any connected atoms which bend in above planes. Moreover, both definitions need the four atoms specification, what is characteristic for torsion or out of plane definitions, but not for the bend. Additionally, when the “bendings” definitions are used, in the movement connected with 3-2-4 bending participate ex-definition the sum of 1-2-3 and 1-2-4 bendings, what not occur when the torsion definitions are used. From the other hand, some orthodox believe,, than the torsion definition can be used to connected in one string (Z letter), but not connected in the Y letter. From the mathematical point of view both definitions are equitable.?
In other situation, one of my college received from an orthodox the advice: use only the bendings, and torsion use only for the describing of rotations. From my experience, I know that the rotation, for example of CH3 groups, can be described by the SUM of the THREE torsion. The simple torsion or the difference of torsion can be use equally with bendings, especially in the 1100-600 cm-1 region. From my observation I conclude, that some researchers do not fully understand the torsion angle idea and definition, what implies that they avoid using them in solving the practical problems.
It's common view that torsion degrees of freedom are used in modelling linear or helix molecules such as polymers, proteins, DNA and others. In those structures, the regarded four atoms fragment is often present.
In analysing such a compound one meet the problem. With the grown of the molecule size, the PED analysis became more difficult. But with the help of VEDA program we can do it with over 90-atoms molecules (above 270 vibrations), triterpene xylosides, isolated in USA from natural products [9,10].
Conclusions
As the PED analysis is arbitrary, I postulate that in the future, the editors and reviewers should let the authors use the internal coordinates according to their skills and inventions. PED analysis was successfully applied since in second half of XX century, but only for small molecules (up to maximum 20 atoms). But biochemist rather is not interested in such a small structures. VEDA program can manage with over 200 atoms structures.
References
3. Jamróz MH (2004) Vibrational Energy Distribution Analysis: VEDA 4, program, Warsaw.