Short Communication
Author: Takashi Hitsumoto*
Hitsumoto Medical Clinic, Yamaguchi, Japan
Corresponding author
Takashi Hitsumoto, Hitsumoto Medical Clinic, 2-7-7, Takezakicyou, Shimonoseki-City, Yamaguchi 750-0025, Japan
Phone: +81-83-223-0657
Fax: +81-83-233-0657
E-mail: web@hitsumoto.info
Received Date: 07th January 2017;
Accepted Date: 09th March 2017;
Published Date: 16th March 2017
Citation
Hitsumoto T (2017) Impact of Skin Autofluorescence on High Sensitivity Troponin T in Japanese Patients with Obesity. Enliven: Clin Cardiol Res 3(1): 001
Copyright
@ 2017 Dr. Takashi Hitsumoto. This is an Open Access article published and distributed under the terms of the Creative Commons Attribution License, which permits unrestricted use, distribution and reproduction in any medium, provided the original author and source are credited
Abstract
Background:
Skin autofluorescence (AF) is known to be a risk factor for various diseases. However, no studies have reported a correlation between skin AF and high sensitivity troponin T (hs-cTnT) in patients with obesity. The aim of this study was to clarify the impact of skin AF on hs-cTnTin Japanese patients with obesity from perspective of primary prevention of cardiovascular disease.
Methods:
Japanese patients with obesity [body mass index ≥25 kg/m2, N = 419, 255 males and 164 females; mean age, 66 ± 12 years (mean ± standard deviation)] without a history of cardiovascular events were enrolled in the study. Hs-cTnT levels and skin AF were measured using commercial device, and relationships between hs-cTnT levels and various clinical parameters including skin AF were examined.
Results:
Hs-cTnT was detected in 345 (82.3%) patients. Skin AF was significantly higher in patients with detectable hs-cTnT than in those without detectable hs-cTnT (2.6 ± 0.5 AU vs. 2.2 ± 0.4 AU, respectively, P < 0.001). In patients with detectable hs-cTnT, there was a significantly positive correlation between skin AF and hs-cTnT (r = 0.31, P < 0.001). Furthermore, multiple regression analyses revealed that the cardio-ankle vascular index was a marker of arterial function; blood concentrations of brain natriuretic peptide, skin AF, reactive oxygen metabolites as markers of oxidative stress, body mass index, and age were selected as independent variables when hs-cTnT was used as a subordinate factor.
Conclusions:
These results indicate that skin AF reflects hs-cTnT levels in Japanese patients with obesity.
Keywords
Skin autofluorescence, Obesity, High-sensitivity troponin T, Oxidative stress, Cardio-ankle vascular index
Introduction
It is well known that obesity is closely associated with lifestyle and vascular events, such as coronary or cerebrovascular disease. Furthermore, a recent clinical study indicated that obesity is a risk factor for heart failure [1]. However, the mechanisms by which obesity leads to vascular events or heart failure are incompletely understood [2, 3].
Troponin T is known to be released from the myocardium to the blood following myocardial injury. In addition, recent clinical and epidemiological studies have demonstrated that the blood concentration of cardiac troponin T (ie, high-sensitivity cardiac troponin T [hs-cTnT]), measured using a highly sensitive assay. Clinically, blood levels of hs-cTnT represent a useful biomarker for evaluating the pathogenesis of not only heart failure but also subclinical myocardial injury or predictor of cardiovascular events [4-7]. In a community study, Ndumele et al. reported that the combination of hs-cTnT and obesity predicts heart failure due to the risk of atherosclerosis [8]. Thus, hs-cTnT levels in patients with obesity are considered an important biomarker of the subclinical stages of heart failure.
Advanced glycation end products (AGEs) play an important role in various diseases, such as diabetes, kidney failure, and cardiovascular disease. Among the methods used to evaluate AGEs, skin autofluorescence (AF) is known to be a useful marker of AGEs in vivo. In fact, some clinical studies have reported a relationship between skin AF and diabetic complications or cardiovascular disease [9, 10]. On the other hand, only a few reports have suggested a clinical effect of skin AF on obesity [11, 12]. Furthermore, no studies have reported a correlation between skin AF and hs-cTnT in patients with obesity. Therefore, the present study was conducted to clarify the relationship between skin AF and hs-cTnT in patients with obesity from perspective of primary prevention of cardiovascular disease including heart failure.
Materials and Methods
Study population
This study was conducted at the Hitsumoto Medical Clinic in Shimonoseki City between March 2013 and February 2015. The study population consisted of 419 Japanese outpatients with obesity (body mass index ≥ 25 kg/m2) with cardiovascular risk factors, such as hypertension, dyslipidemia, and diabetes mellitus. No patients in this study had a history of cardiovascular events, such as ischemic heart disease, stroke, perivascular disease, or heart failure. There were 255 (60.9%) males and 164 (39.1%) females in this study, with a mean age of 66 ± 12 years (mean ± standard deviation). All participants provided informed consent, and the study protocol was approved by the Local Ethics Committee of the Hitsumoto Medical Clinic.
Measurement of skin autofluorescence
Skin AF was measured using a commercial instrument (AGE Reader™; DiagnOptics, Groningen, Netherlands), as described previously [13, 14]. Briefly, AF was defined as the average light intensity per nanometer between 300 and 420 nm. Levels of skin AF were expressed in arbitrary units (AU). With patients seated, all measurements were taken at the volar side of the lower arm, approximately 10–15 cm below the elbow. Pentosidine levels, which are a major component of AGEs, were measured in the volar side of the lower arm by skin biopsy and appeared to correlate with skin AF [15].The validity and reliability of skin AF levels in a Japanese population measured using this method has been previously established [10,14].
Estimation of cardiovascular risk factors
Various clinical parameters, as well as classic coronary risk factors, insulin resistance, kidney function, brain natriuretic peptide (BNP) levels, inflammation, oxidative stress, arterial function, and hs-cTnT levels, were evaluated. Hypertension was defined as a systolic blood pressure greater than or equal to 140 mm Hg, a diastolic blood pressure greater than or equal to 90 mm Hg, or the use of an anti hypertensive treatment. Dyslipidemia was defined as a low-density lipoprotein cholesterol level greater than or equal to 140 mg/dL, a high-density lipoprotein cholesterol level less than or equal to 40 mg/dL, a triglyceride level greater than or equal to 150 mg/dL, or the use of an anti dyslipidemic treatment. Diabetes mellitus was defined as a fasting blood glucose level greater than or equal to 126 mg/dL or the use of an anti diabetic treatment. This study used the cardio-ankle vascular index (CAVI) as an arterial function marker; CAVI was measured using a VaSera CAVI instrument (Fukuda Denshi Inc., Tokyo, Japan), according to previously described methods [16]. Briefly, both brachial and ankle pulse waves were determined using inflatable cuffs; cuff pressure was maintained between 30 and 50 mm Hg to ensure that it had only a minimal effect on the systemic hemodynamics. The blood and pulse pressures were simultaneously determined, and the measurements were obtained with the subject in a supine position. CAVI was measured after the subject rested for 10 minutes in a quiet room. The average coefficient of variation of CAVI has been shown to be less than 5%, which is small enough for clinical use and indicates that the CAVI measurement has good reproducibility. In addition, right brachial blood pressure was automatically measured twice using the oscillometric method. An average of two readings was used to determine systolic and diastolic blood pressures.
Blood sampling
Blood samples were collected from the antecubital vein in the morning after 12 hours of fasting. Total cholesterol and triglyceride levels were measured using standard enzymatic methods. Serum high-density lipoprotein cholesterol levels were measured by selective inhibition. Serum low-density lipoprotein cholesterol levels were calculated using the Friedewald equation [17]. Glucose and insulin levels were measured using the glucose oxidase method and an enzyme immunoassay, respectively. To measure insulin resistance, the HOMA-IR was calculated as follows [18]: HOMA-IR = fasting glucose concentration (mg/dL) × fasting insulin concentration (µg/mL)/405. The eGFR was calculated using the adjusted Modification of Diet in Renal Disease Study equation, which was proposed by the working group of the Japanese Chronic Kidney Disease Initiative [19]. Blood levels of BNP were measured using a commercial kit (SHIONOSPOT Reader; Shionogi & Co., Ltd., Osaka, Japan). High-sensitivity C-reactive protein (hs-CRP) levels were measured using high-sensitivity, latex-enhanced immunonephelometry. The reactive oxygen metabolites (d-ROMs) test, which reflects blood hydroperoxide concentrations, was performed using a commercial kit (Diacron; Grosseto, Italy) [20]. Hs-cTnT levels were also measured using a commercial kit (Roche Diagnostics, Switzerland) [21]. For the hs-cTnT assay, the lower limit of detection was 0.003 ng/mL.
Statistical analysis
A commercially available statistical software program (Stat View-J 5.0; HULINKS Inc., Tokyo, Japan) was used for all statistical analyses. Data are expressed as the mean ± standard deviation. Between-group comparisons were performed using the Student’s t test or Mann-Whitney’s U test, and the correlation coefficient was estimated using the Spearman rank-order correlation analysis. To clarify which independent factors contributed to increased hs-cTnT levels, a multiple regression analysis was performed, using hs-cTnT as a subordinate factor. A P value less than 0.05 was considered statistically significant.
Results
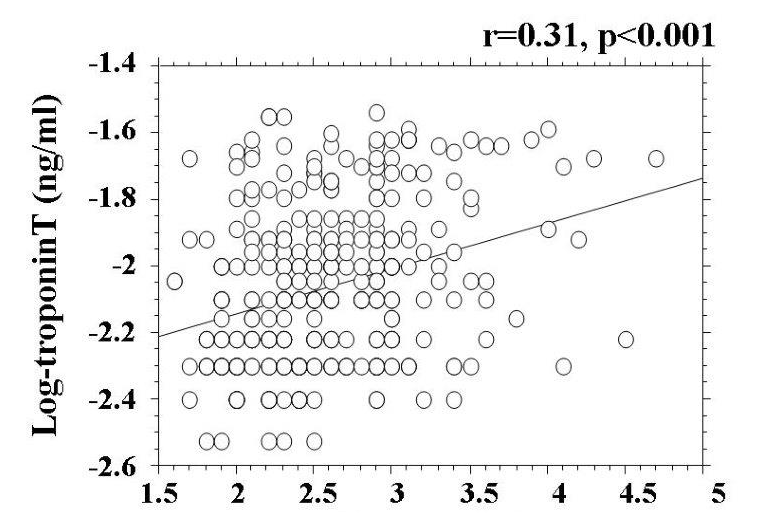
Skin AF levels are shown in Figure 1. Skin AF levels ranged from 1.3 AU to 4.7 AU, and the median value was 2.5 AU. Patient characteristics are presented in Table 1. Hs-cTnT was detected in 345 (82.3%) patients. Age, body mass index, presence of diabetes mellitus, fasting blood glucose levels, d-ROMs test, BNP levels, and CAVI were significantly higher, and eGFR was significantly lower, in patients with detectable hs-cTnT. Skin AF was significantly higher in patients with detectable hs-cTnT than in those with undetectable hs-cTnT. Table 2 shows correlations between hs-cTnT levels, skin AF, and various clinical parameters in the cohort with detectable hs-cTnT. Age, body mass index, presence of hypertension, presence of diabetes mellitus, hs-CRP levels, a positive d-ROMs test, BNP levels, eGFR, and CAVI were all significantly correlated with levels of hs-cTnT. Furthermore, male gender, age, presence of hypertension, systolic blood pressure, presence of diabetes mellitus, fasting blood glucose levels, hs-CRP levels, a positive d-ROMs test, BNP levels, eGFR, and CAVI were significantly correlated with skin AF. Correlations between hs-cTnT and skin AF are shown in Figure 2. Significantly positive correlations were observed between these two parameters.
The results of the multiple regression analysis are presented in Table 3. From the analysis, CAVI, BNP levels, skin AF, positive d-ROMs test, body mass index, and age were selected as independent variables when hs-cTnT was used as a subordinate factor.
Figure 1:Histogram of skin AF values Skin AF levels were distributed ranging from 1.3AU to 4.7AU and the median valueswere 2.5AU. AF=autofluorescence.
Figure 1:Histogram of skin AF values Skin AF levels were distributed ranging from 1.3AU to 4.7AU and the median valueswere 2.5AU. AF=autofluorescence.
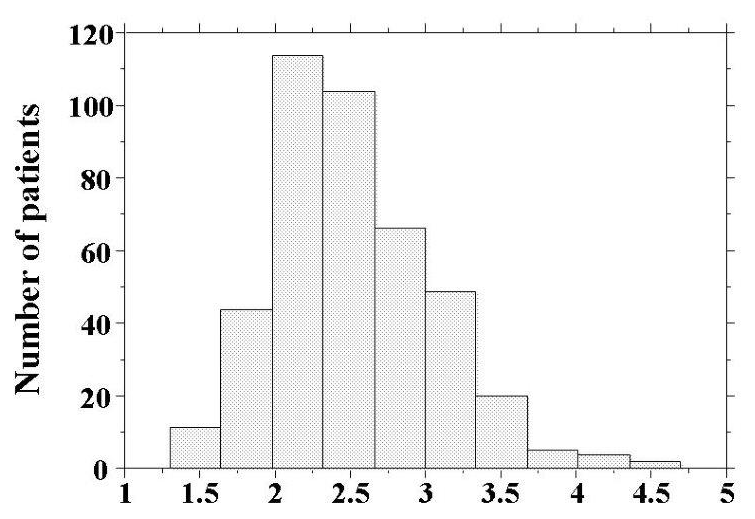
Figure 2: Relationship between hs-cTnT and skin AF values There is significantly positive correlations between log-hs-cTnT and skin AF values (r=0.31, p<0.001) Abbreviations as in Table 1.
Figure 2: Relationship between hs-cTnT and skin AF values There is significantly positive correlations between log-hs-cTnT and skin AF values (r=0.31, p<0.001) Abbreviations as in Table 1.
| Overall | hs-cTnT nondetection |
hs-cTnT detection |
P Value | |
| n (Male/Female) | 419 (255/164) | 74 (40/34) | 345 (215/130) | 0.189 |
| Age (years) | 66±12 | 61±11 | 67±11 | <0.001 |
| Body mass index (Kg/m2) | 27.8±2.5 | 27.2±2.5 | 28.1±2.5 | <0.01 |
| West circumference (cm) | 91±6 | 91±6 | 92±6 | 0.482 |
| Smoking n (%) | 87 (20.8) | 15 (20.3) | 72 (20.9) | 0.901 |
| Hypertension (%) | 315 (75.2) | 52 (70.3) | 263 (76.2) | 0.278 |
| Systolic BP (mmHg) | 142±18 | 140±18 | 140±18 | 0.462 |
| Diastolic BP (mmHg) | 84±12 | 85±11 | 84±12 | 0.743 |
| Diabetes mellitus (%) | 155 (37.0) | 18 (24.3) | 137 (39.7) | <0.05 |
| FBG (mg/dl) | 111±23 | 106±19 | 112±23 | <0.05 |
| IRI (μg/ml) | 9.1±4.1 | 8.6±3.8 | 9.2±4.2 | 0.284 |
| Log-HOMA-IR | 0.34±0.26 | 0.29±0.28 | 0.35±0.25 | 0.082 |
| Skin AF (AU) | 2.5±0.5 | 2.2±0.4 | 2.6±0.5 | <0.001 |
| Dyslipidemia (%) | 318 (75.9) | 56 (75.1) | 252 (73.0) | 0.707 |
| Total cholesterol (mg/dl) | 221±41 | 219±42 | 221±41 | 0.541 |
| LDL cholesterol (mg/dl) | 136±37 | 135±40 | 137±38 | 0.658 |
| Triglyceride (mg/dl) | 179±72 | 170±83 | 180±69 | 0.279 |
| HDL cholesterol (mg/dl) | 49±15 | 49±14 | 48±15 | 0.620 |
| Log-hs-CRP (mg/L) | -1.1±0.4 | -1.0±0.4 | -1.1±0.4 | 0.257 |
| d-ROMs test (U. Carr) | 331±75 | 300±71 | 337±75 | <0.001 |
| Log-BNP (pg/ml) | 1.6±0.4 | 1.5±0.3 | 1.6±0.4 | <0.001 |
| eGFR (ml/min/1.73m2) | 66±21 | 75±19 | 64±20 | <0.001 |
| CAVI | 8.8±1.5 | 7.9±1.2 | 9.0±1.4 | <0.001 |
| Log-hs-cTnT (ng/ml) | -2.1±0.2 | - | -2.1±0.2 | - |
| Medication | ||||
| RAS inhibitor, n (%) | 204 (48.6) | 34 (45.9) | 170 (49.2) | 0.753 |
| Statin, n (%) | 141 (33.6) | 24 (32.6) | 117 (33.9) | 0.689 |
Table 1: Patient Characteristics
Data are expressed mean ±SD, hs-cTnT: high-sensitivity cardiac troponin T, BP: blood pressure, FBG: fasting blood glucose, IRI: immuno reactive insulin, HOMA-IR: homeostatic model assessment of insulin resistance, AF: autofluoresence, LDL: low- density lipoprotein, HDL: high-density lipoprotein, hs-CRP: high sensitivity C-reactive protein, d-ROMs: derivatives of reactive oxygen metabolites, BNP: brain natriuretic peptide , eGFR: estimated glomerular filtration rate, CAVI: cardio-ankle vascular index RAS: renin-angiotensin system
| Log-hs-cTnT | Skin AF | |
| r | r | |
|
Sex (Female=0, Male=1) |
-0.09 | 0.10*** |
|
Age |
0.22* | 0.27* |
|
Body mass index |
0.11*** | -0.09 |
|
West circumference |
0.10 | -0.07 |
|
Smoking (No=0, Yes=1) |
0.02 | 0.09 |
|
Hypertension (No=0, Yes=1) |
0.12*** | 0.11*** |
|
Systolic BP |
0.08 | 0.11*** |
|
Diastolic BP |
0.04 | 0.04 |
|
Diabetes mellitus (No=0, Yes=1) |
0.14*** | 0.15** |
|
FBG |
-0.02 | 0.10*** |
|
IRI |
-0.04 | 0.01 |
|
Log-HOMA-IR |
-0.04 | 0.04 |
|
Dyslipidemia (No=0, Yes=1) |
-0.08 | -0.01 |
|
Total cholesterol |
-0.10 | 0.04 |
|
LDL cholesterol |
-0.10 | 0.03 |
|
Triglyceride |
-0.08 | 0.06 |
|
HDL cholesterol |
-0.06 | -0.03 |
|
Log-hsCRP |
0.18** | 0.11*** |
|
d-ROMs test |
0.35* | 0.25* |
|
Log-BNP |
0.29* | 0.10*** |
|
eGFR |
-0.24* | -0.19* |
|
CAVI |
0.38* | 0.47* |
|
RAS inhibitor (No=0, Yes=1) |
-0.06 | -0.05 |
|
Statin (No=0, Yes=1) |
0.03 | 0.02 |
Table 2: Correlation between hs- cTnT, skin AF and Clinical Parameters in hs-cTnT detectable Patients.
r expressed correlation coefficient.
*p<0.001, **p<0.01, ***p<0.05, Abbreviations as in Table 1
| β | t value | p value | |
| Explanatory factor | |||
| CAVI | 0.22 | 3.7 | <0.001 |
| Log-BNP | 0.21 | 3.6 | <0.001 |
| Skin AF | 0.14 | 2.6 | <0.01 |
| d-ROMs test | 0.12 | 2.2 | <0.05 |
| Body mass index | 0.11 | 2.1 | <0.05 |
| Age | 0.11 | 2.1 | <0.05 |
| Log-hs-CRP | 0.10 | 1.9 | 0.061 |
| Hypertension | 0.08 | 1.3 | 0.289 |
| Diabetes mellitus | 0.07 | 1.2 | 0.293 |
| FBG | 0.07 | 1.2 | 0.295 |
| eGFR | -0.06 | -1.2 | 0.297 |
| Sex | -0.02 | -0.3 | 0.794 |
| Systolic BP | -0.04 | -0.7 | 0.487 |
Table 3: Multiple regression analysis for hs-cTnT.
R2=0.31, Fvalue = 13.3,?p<0.001, Abbreviation as in Table 1
Discussion
This study shows a significant relationship between hs-cTnT and skin AF, reflecting tissue accumulation of AGEs in Japanese patients with obesity. The measurement of skin AF is non-invasive, simple, and reliable. Therefore, the present observations support the advantages of measuring skin AF, a useful marker of hs-cTnT elevation, in the clinic. On the other hand, the degree of obesity, oxidative stress, and arterial dysfunction were also significantly related to increases in hs-cTnT levels by multivariate analysis.
A clinical study of a healthy Japanese population [7] revealed that detectable hs-cTnT was found in 67.7% of individuals, with a detection limit 0.003 ng/mL. The results of the present study indicated that detectable hs-cTnT was found in 82.3% of the population, with the same detection limit. Even though the mean age in this study population was higher than that reported in the healthy population study, the results of the present study indicated that hs-cTnT was highly detected in Japanese patients with obesity, suggesting that myocardial injury in obese individuals is progressive during the subclinical stages of heart failure. Furthermore, body mass index was also selected as an independent variable, using hs-cTnT as a subordinate factor. Thus, the degree of obesity is associated with hs-cTnT elevation; body weight reduction, thus, appears necessary to prevent heart failure or vascular events in both Caucasian and non-Caucasian populations.
Recently, Hofmann et al. examined the relationship between AGE-modified, cardiac tissue collagen levels and skin AF, reporting a significant correlation [22]. Thus, the levels of AGEs found in the volar side of the lower arm appear to reflect the degree of AGE accumulation in cardiomyocytes. Additionally, other studies identified several pathways by which AGEs or receptors of AGEs (RAGEs) could influence myocardial injury in a diabetes model [23, 24]. Ma et al. [23] reported that diabetes resulted in a significant increase in AGE and RAGE levels in the heart, especially in cardiomyocytes, using mice in which streptozotocin was used to induce diabetes. These authors also reported that AGE-induced cardiomyocyte dysfunction was linked to mitochondrial membrane depolarization and reduced GSK-3b inactivation, events that can be prevented by RNA interference knockdown of RAGE expression. Thus, AGEs and RAGEs are believed to play important roles in myocardial injury under diabetic conditions. In this study, skin AF was selected as an independent variable, using hs-cTnT as a subordinate factor, after adjusting for the presence of diabetes mellitus and fasting blood glucose levels. Therefore, AGEs and RAGEs possibly affect myocardial injury in patients with obesity, independent of the presence of diabetes mellitus.
Oxidative stress is closely associated with heart failure progression or vascular events. Several pathways whereby oxidative stress leads to myocardial injury have been identified, including dysfunction of the mitochondrial electron transport complex, nicotinamide adenine dinucleotide phosphate oxidase activity, and myocardial cell apoptosis [25, 26]. Furthermore, the present study revealed the importance of oxidative stress in myocardial injury that occurs with obesity and during the subclinical stages of heart failure. In addition, a number of basic and clinical studies have shown the close association between AGEs or RAGEs and oxidative stress. Furthermore, an association between AGEs or RAGEs and oxidative stress in myocardial cells has been reported [27]. In this study, a significant correlation was observed between skin AF and a positive d-ROMs test as a marker of oxidative stress in vivo, suggesting that the association between AGEs or RAGEs and oxidative stress in myocardial cells, consequently, causes hs-cTnT elevation in patients with obesity.
In this study, CAVI was selected as one of the strongest variables, using hs-cTnT as a subordinate factor. CAVI is known to be a marker of arterial stiffness, which is independently associated with blood pressure levels. In recent years, several studies have indicated the importance of left ventricular dysfunction in the progression of myocardial injury; furthermore, increases in aortic artery stiffness are known to be caused by left ventricular dysfunction [28]. Therefore, the relationship between hs-cTnT and CAVI identified in this study is believed to reflect myocardial injury via left ventricular dysfunction, resulting from an increase in vascular resistance or after load. Endothelial dysfunction is also a crucial factor in the development of heart failure. A clinical study reported that CAVI is indicative of endothelial dysfunction [29], which is also known to cause left ventricular dysfunction or myocardial injury [30, 31]. Thus, the results of this study suggest an impact of arterial function, such as arterial stiffness or endothelial dysfunction, on subclinical myocardial injury in patients with obesity. On the other hand, results of this study also showed a significantly positive correlation between skin AF and CAVI. Therefore, increases in skin AF, as a causative factor of elevation of hs-cTnT in patients with obesity, may be partly explained by arterial dysfunction.
This study has several limitations. First, ultrasonic echocardiography, coronary angiography, and multi detector computed tomography angiography were not performed; therefore, cardiovascular diseases, such as heart failure or coronary artery disease, may be undetected in the study patients. Second, medical treatments, including the administration of renin-angiotensin receptor inhibitors or statins, may have influenced the study results, even though the study results indicate that the effects of these drugs were insignificant. Finally, this study was cross-sectional in a single unit, and the sample size was relatively small. Additional prospective studies, including evaluations of interventional therapies, are required to clarify the clinical significance of skin AF as a risk factor for heart failure or vascular events in patients with obesity.
In conclusion, the study findings indicate that skin AF levels reflect hs-cTnT in Japanese patients with obesity.
Disclosure
The Author declares that there is no conflict of interest.
References
- Lavie CJ, Alpert MA, Arena R, Mehra MR, Milani RV, et al (2013) Impact of obesity and the obesity paradox on prevalence and prognosis in heart failure. JACC Heart Fail 1:93-102
- Kenchaiah S, Evans JC, Levy D, Wilson PW, Benjamin EJ, et al (2002) Obesity and the risk of heart failure. N Engl J Med 347:305-313.
- Abel ED, Litwin SE, Sweeney G (2008) Cardiac remodeling in obesity. Physiol Rev 88:389-419.
- Latini R, Masson S, Anand IS, Missov E, Carlson M, et al;Val-HeFT Investigators (2007) Prognostic value of very low plasma concentrations of troponin T in patients with stable chronic heart failure. Circulation116:1242-1249.
- Sato Y, Yamamoto E, Sawa T, Toda K, Hara T, et al (2011) High-sensitivity cardiac troponin T in essential hypertension. J Cardiol58: 226-231.
- Saunders JT, Nambi V, de Lemos JA, Chambless LE, Virani SS, et al (2011) Cardiac troponin T measured by a highly sensitive assay predicts coronary heart disease, heart failure, and mortality in the Atherosclerosis Risk in Communities Study. Circulation123:1367-1376.
- Otsuka T, Kawada T, Ibuki C, Seino Y (2010) Association between high-sensitivity cardiac troponin T levels and the predicted cardiovascular risk in middle-aged men without overt cardiovascular disease. Am Heart J 159:972-978.
- Ndumele CE, Coresh J, Lazo M, Hoogeveen RC, Blumenthal RS, et al (2014) Obesity, subclinical myocardial injury, and incident heart failure.JACC Heart Fail 2:600-607.
- Lutgers HL1, Graaff R, Links TP, Ubink-Veltmaat LJ, Bilo HJ, et al (2006) Skin autofluorescence as a noninvasive marker of vascular damage in patients with type 2 diabetes. Diabetes Care 29:2654-2659.
- Hangai M, Takebe N, Honma H, Sasaki A, Chida A, et al (2016) Association of Advanced Glycation End Products with coronary Artery Calcification in Japanese Subjects with Type 2 Diabetes as Assessed by Skin Autofluorescence. J Atheroscler Thromb 23:1178-1187.
- Arsov S, Trajceska L, van Oeveren W, Smit A J, Dzekova P, et al (2015) The influence of body mass index on the accumulation of advanced glycation end products in hemodialysis patients. Eur J ClinNutr 69:309-313.
- Ahmad MS, Damanhouri ZA, Kimhofer T, Mosli HH, Holmes E (2015) A new gender-specific model for skin autofluorescence risk stratification. Sci Rep 5:10198.
- Meerwaldt R, Hartog JW, Graaff R, Huisman RJ, Links TP, et al (2005) Increased accumulation of skin advanced glycation end-products precedes and correlates with clinical manifestation of diabetic neuropathy. J Am SocNephrol 16:3687-3693.
- Nomoto K, Yagi M, Arita S, Hamada U, Yonei Y (2012) A survey of fluorescence derived from advanced glycation end products in the skin of Japanese: differences with age and measurement location. Anti-Aging Medicine 9:119-124.
- Meerwaldt R1, Graaff R, Oomen PH, Links TP, Jager JJ, et al (2004) Simple non-invasive assessment of advanced glycation endproduct accumulation. Diabetologia 47:1324-1330.
- Shirai K, Utino J, Otsuka K, Takata M (2006) A novel blood pressure-independent arterial wall stiffness parameter; cardio-ankle vascular index (CAVI). J Atheroscler Thromb13:101-107.
- Friedewald WT, Levy RI, Fredrickson DS (1972) Estimation of the concentration of low-density lipoprotein cholesterol in plasma, without use of the preparative ultracentrifuge. Clin Chem18:499-502.
- Matthews DR, Hosker JP, Rudenski AS, Naylor BA, Treacher DF, et al (1985) Homeostasis model assessment: insulin resistance and beta-cell function from fasting plasma glucose and insulin concentrations in man. Diabetologia 28:412-419.
- Imai E, Horio M, Nitta K, Yamagata K, Iseki K, et al (2007) Estimation of glomerular filtration rate by the MDRD study equation modified for Japanese patients with chronic kidney disease. Clin Exp Nephrol 11:41-50.
- Cesarone MR, Belcaro G, Carratelli M, Cornelli U, De Sanctis MT, et al (1999) A simple test to monitor oxidative stress. Int Angiol 18:127-130.
- Mingels A, Jacobs L, Michielsen E, Swaanenburg J, Wodzig W, et al (2009) Reference population and marathon runner sera assessed by highly sensitive cardiac troponin T and commercial cardiac troponin T and I assays. Clin Chem 55:101-108.
- Hofmann B, Jacobs K, Navarrete Santos A, Wienke A, et al (2015) Relationship between cardiac tissue glycation and skin autofluorescence in patients with coronary artery disease. Diabetes Metab 41:410-415.
- Ma H, Li SY, Xu P, Babcock SA, Dolence EK, et al (2009) Advanced glycation endproduct (AGE) accumulation and AGE receptor (RAGE) up-regulation contribute to the onset of diabetic cardiomyopathy. J Cell Mol Med 13:1751-1764.
- Brett J1, Schmidt AM, Yan SD, Zou YS, Weidman E, et al(1993) Survey of the distribution of a newly characterized receptor for advanced glycation end products in tissues. Am J Pathol 143:1699-1712.
- Li SY, Yang X, Ceylan-Isik AF, Du M, Sreejayan N, et al (2006) Cardiac contractile dysfunction in Lep/Lep obesity is accompanied by NADPH oxidase activation, oxidative modification of sarco(endo)plasmic reticulum Ca2+-ATPase and myosin heavy chain isozyme switch. Diabetologia 49:1434-1446.
- Boudina S, Abel ED (2010) Diabetic cardiomyopathy, causes and effects. Rev EndocrMetabDisord11:31-39
- Bodiga VL, Eda SR, Bodiga S (2014) Advanced glycation end products: role in pathology of diabetic cardiomyopathy. Heart Fail Rev19:49-63.
- Jaroch J, LobozGrudzien K, Bociaga Z, Kowalska A, et al (2012) The relationship of carotid arterial stiffness to left ventricular diastolic dysfunction in untreated hypertension. KardiolPol 70:223-231.
- Endo K, Saiki A, Ohira M, Miyashita Y, Shirai K (2011) Cardio-ankle vascular index may reflect endothelial function in type 2 diabetes. Int J ClinPract 65: 1200-1201.
- Zizek B, Poredos P (2007) Increased left ventricular mass and diastolic dysfunction are associated with endothelial dysfunction in normotensive offspring of subjects with essential hypertension. Blood Press16:36-44.
- Mart V1, Aymat R, Ballester M, Garc,a J, Carri I, et al (2002) Coronary endothelial dysfunction and myocardial cell damage in chronic stable idiopathic dilated cardiomyopathy. Int J Cardiol 82:237-245.