Research Article
Darshana Gour, and Reddithota J. Krupadam*
National Environmental Engineering Research Institute, Nagpur 440 020, India
Corresponding author
Reddithota J. Krupadam, National Environmental Engineering Research Institute, Nagpur 440 020, India, Tel: +91-712-2249884; Fax: +91-712-2249896; E-mail: rj_krupadam@neeri.res.in
Received Date: 12th August 2014
Accepted Date: 13th October 2014
Published Date: 14th October 2014
Citation
Gour D,Krupadam RJ (2014) Highly Sensitive Analysis of Endocrine Disrupting Chemicals in Pharmaceutical Wastes using Molecularly Imprinted Polymer Extraction hyphenated with Liquid Chromatography-Mass Spectrometry.Enliven: Bio Anal Techniques 1(1): 004.
Copyright
@ 2014 Reddithota J. Krupadam .This is an Open Access article published and distributed under the terms of the Creative Commons Attribution License, that permits unrestricted use, distribution and reproduction in any medium, provided the original author and source are credited.in any medium, provided the original author and source are credited.
Abstract
Environmental loading of endocrine disrupting chemicals (EDCs) that originate from pharmaceutical wastes are known to cause adverse impacts on aquatic life and public health. In this article, a new sensitive method has been proposed for quantification of EDCs in complicated pharmaceutical wastes using a molecularly imprinted polymer (MIP) extraction followed by liquid chromatograph-mass spectrometer (LC-MS) analysis. The calibration curves of EDCs showed linearity in the concentration range of 1-100 µg L-1 (r>0.996) with a 10 mL loading of pharmaceutical waste samples. The EDCs recoveries obtained by the MIP for pharmaceutical effluents, air particulates and treated sludge were 91%, 89% and 84%, respectively; and the recovery values were better than the conventional SPE materials such as powdered activated carbon and resin. The quantification of 17β-estradiol, a model EDC molecule, using LC-MS showed an excellent lower limits of detection in the pharmaceutical effluents, air particulates and solid waste in the order of 0.19 µg L-1, 0.13 µg g-1, 0.12 µg g-1, respectively.
Keywords
Endocrine disrupting chemicals; Molecularly imprinted polymers; Solid phase extraction; Pharmaceutical wastes; LC/MS analysis.
Abstract
Environmental loading of endocrine disrupting chemicals (EDCs) that originate from pharmaceutical wastes are known to cause adverse impacts on aquatic life and public health. In this article, a new sensitive method has been proposed for quantification of EDCs in complicated pharmaceutical wastes using a molecularly imprinted polymer (MIP) extraction followed by liquid chromatograph-mass spectrometer (LC-MS) analysis. The calibration curves of EDCs showed linearity in the concentration range of 1-100 ?g L-1 (r>0.996) with a 10 mL loading of pharmaceutical waste samples. The EDCs recoveries obtained by the MIP for pharmaceutical effluents, air particulates and treated sludge were 91%, 89% and 84%, respectively; and the recovery values were better than the conventional SPE materials such as powdered activated carbon and resin. The quantification of 17?-estradiol, a model EDC molecule, using LC-MS showed an excellent lower limits of detection in the pharmaceutical effluents, air particulates and solid waste in the order of 0.19 ?g L-1, 0.13 ?g g-1, 0.12 ?g g-1, respectively.
Abbreviations
AIBN: 2,2-Azobisisobutyronitrile; CTO: Column Oven; DES: Diethylstilbestrol; E2: 17β-Estradiol; E3: Estriol; EDCs: Endocrine Disrupting Chemicals; EDTA: Ethylene Diamine Tetraacetic Acid; EGDMA: Ethylene Glycol Dimethacrylate; ESI: Electron Spray Ionization; ESI-MS-MS: Electron Spray Ionization - Tandem Mass Spectrometry; ETP: Effluent Treatment Plant; FCV: Flow Changeover Value ; FT-IR: Fourier Transform Infrared Spectrophotometer; HPLC-DAD: High Performance Liquid Chromatography with Diode Array Detection; HPLC-UV: High Performance Liquid Chromatography with Ultraviolet Detection; HRTEM: High Resolution Transmission Electron Microscope; LC-MS: Liquid Chromatography - Mass Spectrometer; LOD: Limit of Detection; LOQ: Limit of Quantification; LV: Low Volume; MAA: Methacrylic Acid; MIPs: Molecularly Imprinted Polymers; MS: Mass Spectrometer; NIP: Non-Imprinted Polymer; PAC: Powdered Activated Carbon; PDA: Photodiode Array Detector; PA-DVB/XAD: Polystyrene DivinylBenzene resin; RSD: Relative Standard Deviation; SCL: System Controller; SEM: Scanning Electron Microscope; SIM: Selection Ion Monitoring; SPE: Solid Phase Extraction; SRM: Selected Reaction Monitoring; TDS: Total Dissolved Solids; TEM: Transmission Electron Microscope
Introduction
In recent years there has been an increasing public and scientific concern about the presence of chemicals those disrupt normal hormonal function in aquatic life, wildlife and human beings [1,2]. The recalcitrant nature of endocrine disrupting chemicals (EDCs) persists up to several kilometers from the point of discharge cause imposex conditions such as feminization of male fish [3]. 17β-Estradiol (E2), in particular, reported as a model pollutant of EDCs because of its potential in stimulating the growth and development of the female sex organs in vertebrates [4]. The analytical determination of EDCs in environmental and biological fluids at trace concentrations is one of the important tasks in risk assessment of EDCs. To achieve the sensitivity and selectivity at physiologically active concentrations of the target (ng L-1/µg L-1 in water) requires laborious and time-consuming sample preparation procedures. Otherwise, these compounds will go undetected because of inadequacy of analytical method (in terms of sensitivity and specificity) responsible for adverse effects on aquatic life and human beings.
The pre-concentration using solid phase extraction (SPE) of target analyte is one of the most preferred sample preparation procedures. Typical adsorbents used for solid phase extraction (alkyl silicates, styrene-divinyl benzene, activated carbon and graphitized carbon black) are not selective, and large amount of matrix parameters were co-extracted simultaneously with the target analyte due to non-specific binding of SPE materials . This issue diminishes the separation and enrichment accuracy of SPE materials [5,6].
Recently, Molecularly Imprinted Polymers (MIPs) were reported as an excellent SPE materials for environmental and biological sample cleaning [7-10]. The most commonly used imprinting approach is "non-covalent" imprinting where the MIPs are synthesized in solution by the complexation of a target molecule (in this study, the template is E2) with functional monomers through non-covalent bonds, followed by a polymerization step in the presence of the cross-linker. The template (E2) molecules are then removed, producing a polymer with molecular recognition sites, which are able to selectively rebind the template and analytes of similar structure. Wei et al reported E2-MIPs prepared using one-step precipitation polymerization for E2 extraction from river water samples [11]. Le Noir et al synthesized MIP with E2, extracted 100±0.6% of E2 from aqueous solutions; and the binding capacity of the MIP was 22.4 µg L-1 form a wastewater sample [12]. Gadzala-Kopciuch et al reported a procedure of isolation and determination of steroids including E2 from human urine using MIP-SPE coupled with HPLC-DAD, and the method achieved high sensitivity [13]. Buszewski et al reported application of E2 imprinted polymer as the sorbent material for selective extraction of E2 from biological fluids followed by HPLC with UV detection [14]. Jiang et al demonstrated the specificity of E2 imprinted polymer to three structurally related estrogenic compounds (17β-estradiol, estriol, and diethylstilbestrol) and the MIP showed highly selectivity for E2 with the recoveries of 84.8 ± 6.53% compared with the 19.1 ± 1.93% for non-imprinted polymer (NIP). The detection and quantification limits of the method were 0.023 and 0.076 mg L−1[15]. A flow injection (FI) method for the fluorimetric determination of β-estradiol using a MIP packed into a micro column showed the detection limit of 1.12 µg L−1 [16].
In this article, the highly sensitive determination of E2 in complicated pharmaceutical wastes has been described. The SPE using MIP followed by LC-MS analysis attained sensitivities lower than 1.0 ng L-1. Using cross-reactivity experiments, the selective extraction capacity of MIP for E2 was determined and compared with the commercially available resins and activated carbon. The method proposed in this article is quite simple, accurate and useful in monitoring E2 and other EDCs contamination in aquatic ecosystems.
Methods and Materials
Materials and Reagents
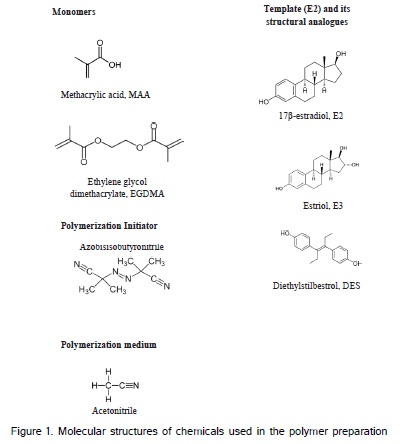
17β-estradiol (E2) and its analogues, estriol (E3), diethylstilbestrol (DES), were purchased from Merck Chemicals (Darmstadt, Germany). The polymer monomers methacrylic acid (MAA) and ethylene glycol dimethacrylate (EGDMA) and the polymerization reaction initiator 2,2’-azobisisobutyronitrile (AIBN) were brought from Sigma-Aldrich (Buchs, Switzerland). The functional monomer MAA was distilled to remove inhibitors under vacuum before use. AIBN was crystallized with ethanol. Powdered activated carbon (PAC) and polystyrene divinylbenzed resin (XAD) were purchased from Acros Organics (Geel, Belgium). The molecular structures of these chemicals are given in (Figure 1). All solvents were of analytical grade or HPLC grade and used as received.
Preparation of E2-imprinted polymer
The E2 imprinted polymer was prepared by dissolving template (E2; 1.0 mmol), functional monomer (MAA; 4 mmol), the cross-linking monomer (EGDMA; 40 mmol) and the initiator (AIBN; 10 mg) in acetonitrile (10 mL). The composition of the polymer is given in (Table 1). The mixture of polymer precursors was purged with nitrogen for about 10 min followed by 5 min sonication. The mixture in the vial was closed and kept in photochemical turntable reactor, which was immersed in a constant temperature bath. A standard laboratory UV light source (medium pressure 450 W mercury arc lamp) jacketed in a borosilicate double-walled immersion well was placed at the center of the turntable. The polymerization was initiated photo-chemically at 20°C and then temperature was maintained by both the cooling jacket surrounding the lamp and the constant temperature bath holding the entire apparatus. The polymerization was allowed to continue for about 10 h. After completion of polymerization, the monolith formed in the vial was grounded in an analytical ball mill and sieved using 200 mesh to collect particle size of 70 µm or less. The polymer particles were washed with methanol: acetic acid (3:1, v/v) solution for several times to remove template. The polymer particles were finally dried in vacuum. In the same way, non-imprinted polymer (NIP) was prepared under identical conditions except for the omission of the template (E2).
| SPE material | Composition | Surface properties | |||||
| Functional monomer, MAA | Cross-linking monomer, EGDMA | Solvent, Acetonitrile | BET surface area | Cumulative pore volume, (cm3 g-1) | Pore area, | Average pore diameter, nm | |
| mmol (mg) | mmol (g) | (mL) | (m2 g-1) | (m2 g-1) | |||
| MIP | 4 (34 ) | 40 (0.79 ) | 10 | 369±10 | 0.35±0.07 | 347±7 | 0.7±0.1 |
| NIP | 4 (34) | 40 (0.79) | 10 | 135±8 | 0.11±0.05 | 96±11 | 90±4 |
Pharmaceutical Waste Samples
Pharmaceutical waste samples were collected from a typical pharmaceutical industry produces anticancer, anti-ulcer, anti-asthmatic, and antacids with the production capacity of 200 tons per annum. The effluents generated from the industry was about 250 m3 d-1 and the ETP with the 3-tier treatment system (primary, secondary and tertiary) was used to treat the effluents. In primary treatment, oil & grease separation, neutralization and stripping, equalization, coagulation and sedimentation processes reduce dissolved solids and adjustment of effluents pH to about 7.0. Then, the effluents were treated with up-flow anaerobic sludge blanket and/or activated sludge to remove dissolved organic matter (represented as biochemical oxygen demand, BOD and chemical oxygen demand, COD). After secondary treatment, the effluents treated with carbon/resin adsorption columns, reverse osmosis, and triple effect evaporation system to remove traces of pharmaceutical residues and dissolved salts. The sludge generated during the treatemnt was managed at sludge handling unit. The sludge generation from ETP was 10-15 kg/day. Using incinerator, the sludge was incinerated between 750 and 1000°C and the ash produced was 2-3 kg/day. The pharmaceutical waste samples collected for the study are:
(i) A solid waste sample was collected from sludge handling system of the ETP. The sludge sample was sun dried and then grounded in a mortar to a fine powder. 1.0 g of the sludge powder was taken in a glass vial and to this sample 2 mL sodium hydrocarbonate solution (0.1M, pH 7.8) was added. The solution was agitated in a water bath for about 1h. The slurry formed in the glass vial was centrifuged at 10 000 rpm for 10 min. The extraction procedure was repeated three times, and the liquid extracts were combined. To the liquid extract, 0.2 g of EDTA was added and centrifuged with 15000 rpm for 30 min. The supernatant of the sample is the sediment leachate.
(ii) The treated effluent sample was collected from Guard pond (a temporary storage pond of treated effluents before discharge) of the ETP. The effluent sample was filtered with glass fibre filter (MN 85/90 BF, Machery-Nagel, Duren, Germany) to remove particles larger than 0.5 µm. Then, the filtrate was collected (10 mL) in a brown bottle and kept at 4°C in the dark until analysis. The free metal ions in the effluent samples were complexed by the addition of about 10 mg of EDTA to the sample. This solution was centrifuged at 15000 rpm for 10 min to remove coagulated ions.
(iii) The air sample was collected using low-volume (LV) air sampler (flow rate: 1.2 m3/h; Make: Spectrolab, India) in the premises of the pharmaceutical industry. The LV sampler was operated for 20±2 h, and the particulates collected on Whatmann GF/B-100 nm glass fiber filter (Buchs, Switzerland) was approximately 0.7-0.9 g. The air particulates were cleaned by ultrasonication in water:acetonitrile (99:1, v/v), and then agitated in methanol for 1 h. After agitation, the glass vial was centrifuged and supernatant was decanted. The decanted solution was air particulate leachate used for the analysis.
SPE Cartridges and Pre-Concentration Experiments
The pre-concentration experiments were conducted using a SPE manifold supplied by SUPELCO (Bellefonte, PA). The SPE cartridges were packed with 100 mg of MIP or other reference SPE materials (NIP, PAC, and XAD) having a size of < 70 μm. Before each run, the SPE cartridges were conditioned by washing with methanol:acetic acid (3:1, v/v) solution. The MIP was transferred into a 10 ml screw-cap scintillation vial and incubated with 5 ml of methanol. The sealed vial was allowed to stand 24 h at ambient temperature with occasional shaking. Then, the slurry was transferred into a 1 ml SPE cartridge equipped with a polyethylene frit (20 μm). The polymer was allowed to settle for 5 min. The adsorbent bed was stabilized by careful insertion of a second frit, avoiding any compression of the polymer filling. The pre-conditioned MIP cartridges were sealed with plungers and stored at 4°C to prevent drying out by solvent evaporation. Prior to any extraction the polymer was washed with an eluting mixture of methanol/water (4:1) containing 1% trifluoroacetic acid until no more residual E2 was eluted from the polymer. For SPE experiments, the polymer was conditioned with 10 mL of methanol and 10 mL of acidified milli-Q water (pH. 5.4).
The E2 and other chemicals extraction capacity of the MIP was evaluated by equilibrium binding analysis. In a series of disposable scintillation vials, 10 mg of MIP was suspended in 10 mL of E2 solutions concentrations ranging from 1 through 25 μg L-1. The mixture was agitated at room temperature for 1 h and then samples were centrifuged at 15000 rpm for 5 min. The concentration of residual E2 was quantified using LC/MS. The extraction capacity was calculated using calibration curves obtained from internal standards. Three repeated measurements were performed for every sample, and the mean of the concentration was recorded. Similar experiments were conducted for other SPE materials i.e., non-imprinted polymer (NIP), powdered activated carbon (PAC) and polystyrene divinylbenzed resin (XAD) to determine their extraction capacities for comparison purpose.
For cross-reactivity studies, solutions of E2 and its structurally related chemicals (estriol, and diethylstilbestrol; 10 mL, 1 μg L-1) in aqueous solution were contacted with the 10 mg of MIP in batch mode. The concentration of the analytes was evaluated both by using MIP and NIP; then the calculated cross-reactivity values were compared those obtained by performing the adsorption in the similar conditions.
The effect of matrix on selective extraction of targeted analyte (E2) was studied by performing SPE with pharmaceutical wastes spiked with different concentration of E2 (0.1 - 10 μg L-1).
LC-MS Analysis of E2 and its' Structural Analogues
LC/MS measurements were carried out using the LCMS-2010A system (Shimadzu; Kyoto, Japan) equipped with a LC-10ADvp solvent delivery pump, CTO-10AVP column oven, FCV-12H two-position flow changeover value and a FCV-13AL six port flow selection valve. LCMS-2010A single-stage quadruple MS detection unit, SPD-M10A photo diode array detector (PDA), SCL-10Avp system controller, and LC/MS solution workstation software.
After pre-treatment with SPE cartridges packed with MIP or other reference materials-XAD and PAC, the pharmaceutical samples were injected into mobile phase (water: methanol - 7:3 v/v; contain 1% trifluoroacetic acid) where E2 elute on the analytical column (Intersil ODS- 3) followed by mass spectroscope (MS) detection. The MS was operated in negative mode electron spray ionization (ESI). In this case, the E2 ion originally has a net positive charge, the addition of counter ions cause reduction in the charge state of E2 ion and also convert into opposite polarity. It was observed that E2 ions changed from positive to negative, hence negative ion mode is more appropriate for MS analysis. The operating conditions maintained for LC/MS analysis were as follows: mobile phase, water/methanol = 70/30 (v/v); flow rate, 0.2 mL min-1 for analysis; sample volume 10 mL; analytical column, Inertsil ODS-3 (150 mm x 2.1 mm); temperature, 40°C; selected ion monitoring (SIM negative), m/z=271; CLD temperature, 200°C; CLD voltage, -20 V; probe voltage, 5 kV; nebulizer gas (He) flow, 1.5 L min-1.
The standard stock solution (1.0 µg L-1) of E2 was prepared in acetonitrile diluted with water obtained from the Milli-Q system, and then filtered through a Whatmann No.41 filter to prepare a calibration curve ranging 0.1 – 100 µg L-1 of E2 solution. The calibration was performed with a six-point curve for E2 with R2 > 0.996. Like each sample, calibration standards were constructed and then analyzed with the internal standard. Recovery of E2 from MIP was determined by spiking standard E2 after extraction from pharmaceutical waste samples. After addition of four internal standards (0.1, 1, 10, and 100 µg L-1) to each extracted sample, a standard addition plot was drawn and linear regression was performed on the data points. The slope of the regression line corresponds to the recovery value. For each type of liquid and solid samples, quality assurance and quality control consisted of one water blank, one spike-blank, and one triplicate sample. Triplicate samples agreed within 10%, and E2 was absent from all water blanks studied.
Results and Discussion
Sample Pre-Treatment and Solid Phase Extraction
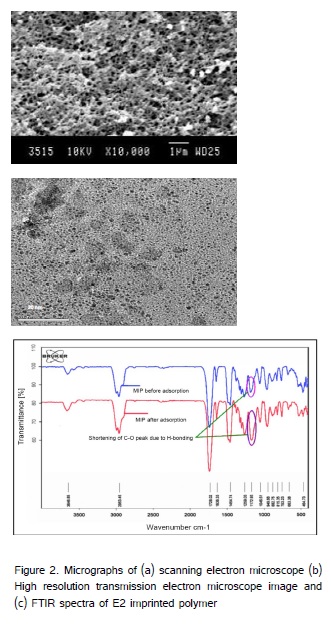
The extraction capacity of the SPE materials is primarily depends on surface area and surface functionality. The imprinted sites formed during molecular imprinting improved the specific surface area and pore volume of the polymer. The polymer surface morphology was characterized using JOEL JSM-5200 scanning electron microscope, operated at a voltage of 15 kV, a current of 10-12 to 10-9 A and 10000 x magnification. A high resolution transmission electron microscope (HRTEM, JOEL 3010) with a UHR pole piece was used to detect tailor-made nanopores of size between 0.1 and 2 nm and above. The polymer samples were gold sputtered at 15 kV for 200 s using JOEL, JFC-1000E ion sputter fine coat under vacuum (~10-3 Torr). The SEM and TEM micrographs of the E2 imprinted polymer was depicted in (Figures 2a and b). The surface functional groups of the polymer were characterized using FTIR spectrophotometer (Bruker, USA). The spectra of the samples were recorded in a KBr matrix and EZOMNIC software was used to collect the peak intensities of IR absorption bands. The FT-IR spectra of the E2 imprinted polymer and its reference polymer is depicted in (Figure 2c). The porosity and surface area of the polymers was determined by nitrogen adsorption/desorption analysis using nitrogen surface area analyzer (JOEL JSM 6400). The sorption measurements showed that the MIP has BET surface area 369 m2 g-1 with cumulative pore volume 0.35 cm3 g-1. The nitrogen adsorption capacity varies between 0.32 and 0.65 cm3 g-1. About 79-83% of total surface area (327±5 m2 g-1) of imprinted polymer consists of micro/nanopores with the diameter between 0.4 and 1.0 nm. The surface properties of MIP and other reference SPE materials are listed in (Table 1).
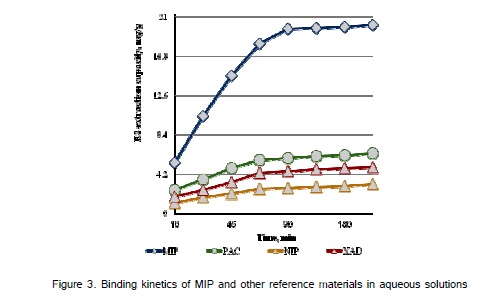
The extraction experiments were conducted using water:acetonitrile (70:30, v/v) where the combination of strong electrostatic binding with hydrophobic interactions provides the successful recognition of E2 in aqueous solutions. The solubility of E2 in water is 1.5 mg L-1 at pH 7.0 [17], and to prepare higher concentrations of E2 small a volumes of acetonitrile was added. The experiments were performed with E2, where the concentrations were in the range of 1.0 – 10 µg L-1 and the solution was pH 7.4. The extraction quantities increased with time and became constant after 2 h (Figure 3a). The optimum contact time was 2 h for highest E2 extraction onto the MIP, i.e., 19.45 mg g-1. The standard deviations were calculated for experiments performed in three different times. The extraction experiments initially carried out with 10 µg L-1 aqueous solution of E2 at pH 7.4. By changing the initial concentration of E2 with the same quantity of MIP (10 mg), extraction experiments were performed to profile extraction capacity of MIP. Shows that there was an excellent recovery of E2 from aqueous solutions (Table 2). The high surface area formed during molecular imprinting in the MIP produced binding sites with different affinity; the concentration of high affinity binding sites are relatively low in the polymer and this could be the reason for a less efficient binding of E2 at concentrations lower than 10 µg L-1. The cartridges prepared with control polymer (NIP) showed a much poorer extraction for E2, in particular at low concentrations, where a more specific binding was required. It could be conclude from the data in (Table 2) was found that the MIP extracted 96% of E2 from water:acetonitrile solution while the other SPE materials used in this study showed the binding capacity 2.76, 4.62 and 5.98 mg g-1 for NIP, XAD and PAC, respectively (Figure3b). The results represents that the E2-imprinted polymer has about 5-fold higher binding capacity for E2 than the other reference SPE materials used in this study.
| SPE materials | Spiked concentration of E2, mg L-1 | Detected concentration of E2, mg L-1 | Recoveries |
| MIP | 1.0±0.16 | 0.98±0.02 | 98±2 |
| NIP | 1.0±0.14 | 0.24±0.03 | 19±4 |
| XAD | 1.0±0.18 | 0.36±0.04 | 9±6 |
| PAC | 1.0±0.15 | 0.14±0.06 | 15±9 |
The selectivity of MIP was determined by extracting E2 from a mixture of E2 and other estrogen analogues - estriol (E3) and diethylstilbestrol (DES) aqueous solutions. The MIP selectivity values given in (Table 3) represents that the MIP showed an excellent "molecular recognition" ability in discriminating E2 from the mixture of E2, E3 and DES in the aqueous solutions. This could be explained by the fact that the MIP possesses specific binding sites (formed during molecular imprinting) for E2 and the structural difference and higher unsaturated -C=C- (in case of DES) would be sufficient for restrict efficient interactions of MIP with E3 and DES. The interactions are expected to take place only at binding sites. This would be the major factor for the less efficient recognition of E3 and DES over the targeted analyte E2 by the MIP. The non-specific adsorption was responsible for binding E2 and its structural analogues almost equal quantities onto PAC, XAD and NIP.
| EDCs | Recovery of E2 onto different SPE materials (%) | |||
| MIP | NIP | XAD | PAC | |
| E2 | 100 | 20 | 9 | 15 |
| E3 | 39 | 24 | 13 | 27 |
| DES | 31 | 23 | 15 | 29 |
LC-MS Analysis of E2 and its Structural Analogues
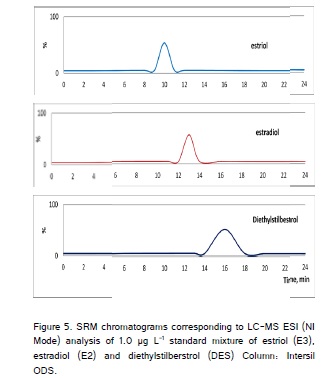
LC-MS measurements were carried out using the LC-MS-2010A system (Shimadzu; Kyoto, Japan) equipped with LC-MS-2010A single-stage quadruple MS detection unit, SPD-M10A photo diode array detector (PDA) and LC-MS solution workstation software. Using a single quadruple MS instrument, ESI was found to achieve detection limits for E2 and other estrogens (E3 and DES) and the ionization mode was capable of detecting E2 in the ng mL-1 range (in negative ion mode). The target E2 undergoes very light fragmentation in the (first) quadruple analyzer showing only one predominant ion. This predominant ion (used as a base peak in the SIM mode or as precursor ion in the SRM mode) corresponded in the case of E2 and other estrogens to the deprotonated molecule, [M-H]. Thus, in the single quadruple instrument, the major ion found for estrogens corresponded to the adduct of the analyte molecule with a sodium atom [M+Na]. The LC-MS analysis of estrogens in ESI (negative ion mode) showed that, the E2 losses consistent with ring cleavages (i.e., losses of C5H12O and C8H14O) to give major product ions at m/z 183 and 145, respectively. Time scheduled SRM conditions used in LC-MS-ESI (negative mode) for the selected EDCs - E2, E3 and DES are given in (Table 4). In the case of E3, produce the [M-H]- ion at m/z 287 gives major product ions at m/z 171 and 145. These ions lose C6H12O2 from the steroidal ring system. In the case of DES, the SRM transitions 267 → 222 and 267→237 should be selected for quantification and confirmation of DES by LC-MS. The reconstructed ion chromatograms obtained in the analysis of a standard mixture of the analytes at the SRM transition used for quantification (Figure 4).
| EDCs | Time, min | SRM Transitions | Cone (V) | Coll. (eV) |
| E2 | 0.00 - 12.9 | 287 → 171 | 50 | 40 |
| 287 → 145 | 50 | 40 | ||
| E3 | 12.9 - 21.1 | 271 → 145 | 50 | 40 |
| 271 → 183 | 50 | 40 | ||
| DES | 12.9 - 21.1 | 267 → 222 | 30 | 35 |
| 267 → 237 | 30 | 50 |
Table 4. Time scheduled SRM conditions used in LC-MS-ESI (negative mode) analysis of targeted analytes
SRM, Selected reaction monitoring; LC-MS-ESI, Liquid chromatograph - mass spectrometer - Electron spray ionization; EDCs, Endocrine disrupting chemicals; E2, 17β-estradiol; E3, Estriol; DES, Diethylstilbestrol;
The LC/MS analysis of E2 in spiked pharmaceutical waste samples showed that the E2 recoveries using MIP packed SPE was about 91% in water: acetonitrile (30:70 v/v). The procedure followed for SPE of E2 and the construction of standard calibration curve provided quite high sensitivity of LC-MS analysis. The method was reasonably accurate, and efficient with respectable recovery and repeatability. The recovery of E2 and other estrogens (E3 and DES) from MIP followed by LC-MS analysis achieved the better lower limit of detection (LOD) than the earlier reported methods (Table 5). Recovery of E2 from MIP was determined by spiking standard E2 with samples. After addition of five internal standards to each sample, a standard-addition plot was constructed and linear regression was performed on the data points. The slope of the regression line corresponds to the recovery value. The calibration curve for E2 determination was obtained by a linear regression analysis of standard solution of 1, 10, and 100 ng L1. The linearity of the calibration curve obtained was good with r2 = 0.991. The calibration curve was expressed as y=17564x–23571. The relative standard deviation (n=5) using the MIP extraction followed by LC-MS analysis varied between 2.7 and 4.3%; and the values are acceptable for environmental analysis.
| Pharmaceutical Sample | Spike concentration, mg L-1 | Intra-day (n=4) | Inter-day (n=4) | LOD | ||||
| Detected concentration, mg L-1 | CV (%) | Bias (%) | Detected concentration, mg L-1 | CV(%) | Bias (%) | |||
| Industrial effluents (I) | 1.0±0.04 | 1.12±0.06 | 9 | -2 | 1.09±0.05 | 5 | 1 | 0.19±0.04 |
| Solid/sludge (S) | 1.0±0.05 | 1.12±0.04 | 7 | 1 | 1.11±0.04 | 7 | -2 | 0.13±0.05 |
| Air particulates (A) | 1.0±0.03 | 1.11±0.03 | 8 | 2 | 1.10±0.06 | 8 | 3 | 0.12±0.06 |
| Standard | 1.0±0.03 | 0.98±0.03 | 4 | 1 | 0.99±0.03 | 4 | 1 | 0.11±0.02 |
Matrix Effect on Recovery of E2 from Pharmaceutical Wastes
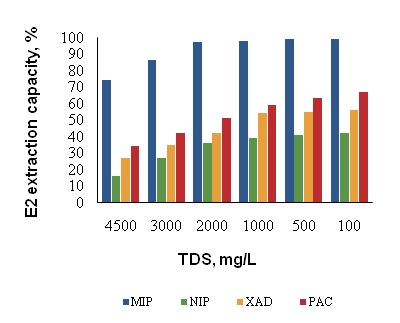
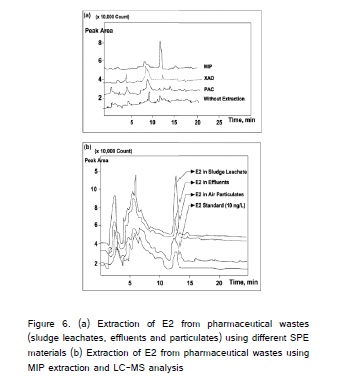
The pharmaceutical wastes are quite complex and are classified as "difficult to biodegradable" wastes. In particular, the effluents showed the concentration of total dissolved solids (TDS) was about 4800 mg L-1 even after treatment. Such high strength TDS samples, the determination of targeted molecules require an efficient extraction procedure. The liquid–liquid extraction and derivitization of estrogens with dansyl chloride coupled with electrospray ionization-tandem mass spectrometry (ESI-MS-MS) provided lowest detection limits for estrogens such as E2, E3 and DES were 35, 26, and 61 µg L-1, respectively [18]. In the present study, lowest E2 detection limit achieved was 0.12 µg L-1 which is about 30-fold lower than the above method. One of the reasons for such high sensitivity of the method could be elimination of matrix interfering parameters such as TDS using MIP extraction. The matrix effect on selective E2 extraction onto the MIP was investigated using pharmaceutical effluents. The effluents were diluted with deionized water with the TDS concentration 2000, 1000, 500 and 100 mg L-1 and then spiked with spiked 1.0 µg L-1 of E2 to each sample before extraction onto the MIP. The E2 extracted by MIP was determined using LC/MS. To be sure of the contribution of non-specific interactions with the external surface of the MIP, the same procedure was followed for E2 extraction with NIP. This comparison indicates the percent of decrease in E2 binding on to the MIP and this information provides sufficient scientific justification about the effect of matrix on the binding mechanism. It was found that in spite of high levels of TDS, the targeted E2 was selectively extracted onto MIP; while the pre-concentration capacity of other SPE materials was less than 35% compared with the MIP (Figure 5). After extraction pre-concentration of E2, there was negligible change in TDS concentration represents that the high TDS have no considerable reduction in the pre-concentration capacity of MIP. Taking into account all the above experimental results, the SPE with MIP has no interference in pre-concentration of E2 until TDS levels 2000 mg L-1 in effluents/ wastewaters. Even though, E2 extracted significantly on PAC (7.98 μg mg-1), during LC/MS analysis interference due to TDS masked the E2 peaks in chromatogram. The chromatograms of E2 cleaned with MIP are very clear and the selective pre-concentration produce clean extract for LC-MS analysis compared to other SPE materials (Figure 6). As shown, the MIP extract of pharmaceutical wastes has produced better quality chromatograms.
Method Validation
Sensitivity, linearity, recoveries, precision and the study of matrix effects were considered as the criteria for the validation of the analytical methodology developed. Validation of data for each matrix studied is presented in (Table 5). Calibration curves were generated using linear regression analysis and over the established concentration range (1-100 ng L-1) gave good fits (r2=0.996). Five point calibration curves were generated daily, and the possible fluctuation in signal intensity was checked by injecting a standard solution at two concentration levels after each 8-10 injections.
Recoveries achieved for all target compounds ranged from 60 to 102% and from 50 to 116% for surface and effluents, respectively. Only diethylstilbestrol, in the case of effluents samples showed lower recovery rates (about 20%). Nevertheless, as other performance data, such as repeatability and sensitivity, were good, the low recovery was not considered to be an obstacle for their reliable determination.
The limits of detection calculated for sediment leachates was between 0.24 and 0.39 ng L-1 for E2 which is lower than the stipulated standard set by regulatory agencies (1.0 ng L-1). The repeatability of E2 determination was evaluated by spiking E2 stock solution into pharmaceutical waste samples to make a final concentration of 10 ng L-1 (n=5). The repeatability was 1.9% RSD. The repeatability of E2 at 10 ng L-1 in industrial effluents was 2.4 % (n=5). LOD and LOQ in the actual industrial effluents were estimated in the same way based on the chromatogram of the 10 ng L-1 spiked industrial effluent samples and were calculated as 0.19 and 0.13 ng L-1, respectively. The method developed for E2 quantification in complex pharmaceutical wastes was three times higher when compared with the peak-to-peak noise of a series of standard chromatographic peaks measured with the consideration of LOD (S/N=3). Consequently, the analysis suggested that the background level of E2 could be negligible as far as water:acetonitrile solvent employed for this experiment. Based on these values for recovery and repeatability from complex waste samples, it was implicit that results were reproducible and therefore reliable determination was achieved.
Conclusions
The optimized MIP-SPE method proved to be an efficient and reproducible for highly selective extraction of E2 from pharmaceutical wastes. Kinetically faster extraction of E2 was achieved and the extraction efficiencies of E2 with MIP were markedly higher than with the conventional SPE materials that were studied. The MIP-SPE followed by LC-MS method for the monitoring of E2 and other estrogens was established. Concentrations measured in pharmaceutical wastes for E2 ranged between 0.13 and 0.19 ng L-1. Good precision and accuracy was achieved in all samples matrices studied. The effects of the relevant matrices were evaluated as well for three different pharmaceutical waste samples. Matrix effects which resulted in masking or enhancement of the measured response of more than 10% was observed where the total dissolved solids concentration exceeded 2000 mg L-1. The method will be used in future studied to provide important information on the exposure of aquatic ecosystems to estrogenic compounds.
Acknowledgments
This work has been supported by Council of Scientific & Industrial Research (CSIR) and Planning Commission, Government of India under Supra Institutional Project: Molecular Environmental Science & Engineering Research.