Research Article
Hemodynamic Assessment and Monitoring in the Intensive Care Unit: an Overview
Adam C. Adler, MD MS1,2*, Ramakant Sharma, MD4,5, Thomas Higgins, MD3,4,5, and William T. McGee, MD3,4,5
1Department of Anesthesiology and Critical Care Medicine, The Children’s Hospital of Philadelphia, Philadelphia
2Department of Anesthesiology and Critical Care Medicine, The University of Pennsylvania Perelman School of Medicine, Philadelphia
3Departments of Internal Medicine Baystate Medical Center, Springfield
4Department of Critical Care Medicine, Baystate Medical Center, Springfield
5Tufts University School of Medicine, Boston
Corresponding author
Adam C. Adler, MD, Department of Anesthesiology and Critical Care Medicine, The Children’s Hospital of Philadelphia, 34th Street and Civic Center Boulevard, Philadelphia, PA 19104, Tel: 786-417-7529; E-mail: adamcadler@gmail.com
Received Date: 06th June 2014
Accepted Date: 12th August 2014
Published Date: 14th August 2014
Citation
Adler AC, Sharma R, Higgins T,McGee WT (2014) Hemodynamic Assessment and Monitoring in the Intensive Care Unit: an Overview. Enliven: J Anesthesiol Crit Care Med 1(4): 010.
Copyright
@ 2014 Dr. Adam C. Adler. This is an Open Access article published and distributed under the terms of the Creative Commons Attribution License, which permits unrestricted use, distribution and reproduction in any medium, provided the original author and source are credited.
Abstract
The goal of hemodynamic monitoring in intensive care is to assess the adequacy of perfusion, specifically with regard to maintaining sufficient perfusion pressures and oxygen delivery. Precise volume management of peri-operative and critical care patients is crucial as under or over resuscitation is associated with adverse outcomes. Hemodynamic monitoring allows care to be individualized based on specific patient response to therapy and can provide early warning of impending perfusion deficits or instability. Physiologic monitoring aids determination of appropriate therapy.
Introduction
The goal of hemodynamic monitoring in intensive care is to assess the adequacy of perfusion, specifically with regard to maintaining sufficient perfusion pressures and oxygen delivery. Precise volume management of peri-operative and critical care patients is crucial as under or over resuscitation is associated with adverse outcomes. Hemodynamic monitoring allows care to be individualized based on specific patient response to therapy and can provide early warning of impending perfusion deficits or instability. Physiologic monitoring aids determination of appropriate therapy.
Methods for obtaining accurate and continuous measurements in the critically ill patient have evolved from surgical and anesthetic techniques dating back more than a century. These techniques transitioned from the operating room to early intensive care units as necessitated by the polio epidemics of the 1950s. The advantages of cohorting critically ill patients led to specialized intensive care and later cardiac care units. Telemetry developed to monitor astronauts and miniaturization of electronics made possible by substituting transistors for vacuum tubes helped create the first generation of intensive care monitors in the 1960s. Transcutaneous oxygen sensors, end-tidal measurement of carbon dioxide, and pulse oximetry took monitoring to a new level by the 1980s. Monitors became more sophisticated and capable of calculating derived variables such as oxygen delivery and consumption as computer processing became routine. These data sets were useful to clinicians using fluids and vasoactive agents primarily to manipulate oxygen delivery in hemodynamically unstable patients. Recently, simply monitoring vascular pressures has given way to dynamic monitoring where physiologic changes with respiration can be used to derive additional parameters such as pulse pressure variation (PPV) and stroke volume variation (SVV). Today’s clinician has a wealth of information available at the bedside. This review will focus on hemodynamic assessment and monitoring, and characterize types of monitors as non-invasive, minimally invasive or invasive.
Non-Invasive Hemodynamic Monitors
Clinical Assessment
Basic clinical assessment of the critical care patient includes measuring vital signs; heart rate, respiratory rate, blood pressure, and body temperature and conducting a physical examination. Assessment of pain, often termed the “fifth vital sign”, is a subjective symptom rather than an objective sign. Pulse oximetry is more appropriately characterized as such for its importance in physiologic monitoring and rapid assessment of physiologic instability. Physical examination complements non-invasive assessment. Pupil size and reactivity and more broadly the Glasgow Coma Scale, are essential components of an initial examination. Chest auscultation can often detect rales or a third heart sound, associated with volume overload. Other clues to a patient’s volume status include assessment of jugular venous distention and height, presence or absence of edema, identification of the hepato-jugular reflux, and strength of the pulse. However, these assessments are highly subjective and suffer from high inter-observer variability [1].
Heart Rate/ EKG
Heart rate (HR) is most often determined by electrocardiography, although the pulse oximeter also provides a pulse rate. Normal resting heart rates are higher in infants and children and decrease with age and degree of physical fitness. Illness such as sepsis, metabolic derangements, endocrinopathies, fever, conduction abnormalities, anemia etc. can lead to alterations in HR. Physiologic states such as pregnancy, stress or extreme physical fitness can also alter heart rate.
Non-Invasive Blood Pressure (NIBP) Measurement
Blood pressure is arguably one of the greatest advances in medical technology. Discovered by Italian physician Scipione Riva-Rocci in the late 19th century, sphygmomanometry was brought to the United States in the early 1900s by neurosurgeon Harvey Cushing [2]. Today’s sphygmomanometer technology typically utilizes the principle of oscillometry, rather than auscultation. Pulsatile arterial flow creates oscillations within the arterial wall, but only when the arteries are partially open. Using an inflatable bladder, pressure can be raised to the point where all flow is inhibited, and then slowly released while monitoring for the appearance and disappearance of pulse waves. Oscillometric devices incorporate a pressure sensor and an electrically operated pump to inflate and release a cuff. Cuff deflation occurs systematically, with a device sensing the amplitude of returned pulsations. The cuff determines the lowest pressure at which maximum returned amplitudes are measured, which corresponds to the mean blood pressure, systolic and diastolic pressure is calculated from this.
Disadvantages of this method of monitoring include: requirement for adequate cuff sizing, relationship to heart rate, effect of low flow states and the effect of overly stiff arteries on reliability of measurement. According to the American Heart Association guidelines for blood pressure management, the recommended adult cuff should be 80% of the patients arm circumference and 40% of the arm width [3,4]. Failure to obtain appropriate cuff sizing may result in blood pressure measurement inaccuracies and alter treatment [5,6].
Temperature
Temperature is a critical variable in disease identification and affects many disease states. Extremes of temperature may lead to dehydration, CNS dysfunction, coagulopathy and both heart rate and rhythm abnormalities. The increased metabolic rate associated with shivering can contribute to myocardial ischemia, and heat-induced tissue destruction can predispose patients to acute renal failure from rhabdomyolysis. As one of the criteria for the Systemic Inflammatory Response Syndrome, temperature is important in the early diagnosis of sepsis and for monitoring the response to treatment. A rapid rise in temperature is seen with the rare but life-threatening disorder malignant hyperthermia, and the more common neuroleptic malignant syndrome.
Normal temperature is defined as 37°C, however, the location of measurement may greatly affect this. Axillary temperatures may vary by approximately 1°C and are less reliable in the ICU setting. Oral temperature is typically 0.3°C below rectal temperature and 0.5°C below core temperatures. Temperature also displays a diurnal rhythm being lowest in the early morning hours and peaking in early evening. Infrared probes used in the ear canal, forehead or temporal regions can measure temperature. The most accurate measure of temperature is core temperature taken typically via a bladder catheter or pulmonary artery catheter equipped with a thermistor, a device that changes electrical conductivity based on temperature.
Respiratory Rate
Respiratory rate can be sampled in the critical care setting in many ways, historically by a timed visual examination. Mechanical ventilators and capnographs provide readout of respiratory rate; EKG leads can also provide information on chest excursion to calculate the rate.
Pulse Oximetry
Continuous pulse oximetry has been one of the most important advances in the monitoring of critically ill patients. Invented in 1972 by Japanese bioengineer Takuo Aoyagi, the oximeter came into widespread clinical use in the 1980s and has become essential to safe anesthetic and critical care practice [7]. Using the principle of spectrophotometry, light of specific wavelengths is emitted, transported through a medium and collected, allowing the concentration of a substance to be detected. The Lambert-Beer law postulates that absorption of light corresponds to the concentration of the substance and the distance the light must travel. Application of this principle for the detection of hemoglobin (Hb) and its variants is termed oximetry. Monochromatic light is emitted from the phototransmitter, typically at 660nm and 940nm, traverses the tissue and is collected by the photodetector. Pulse oximeters are unique in that they only amplify light of alternating intensities [8]. Light waves passing through pulsating arteries develop phasic shifts in intensity and are amplified by the detector. Light passing through non-pulsatile structures, veins and tissue are not detected which serves to reduce sampling error created by deoxygenated blood in the venous system. The four main types of Hb encountered clinically are, oxyhemoglobin (HbO2), deoxyhemoglobin (Hb), carboxyhemoglobin (COHb) and methemoglobin (metHb) [9]. Hb absorbs red light in the visible region (660nm) more effectively than HbO2, while light in the infrared region (940nm) is more intensely absorbed by HbO2 compared with Hb. The amount of HbO2 detected can be expressed as a function of total Hb detected as: Fractional Oxygen Saturation (%) = (HbO2/HbO2+Hb) x 100
The hemoglobin variants, COHb and MetHb can lead to alterations of the measured saturation and sampling errors [9]. Significant skin pigmentation, certain shades of nail polish and severe hypotension may produce sampling based errors [9]. Patients with reduced peripheral blood flow from vascular disease, sepsis or pallor of the extremities may be monitored by ear probes or skin surface probes (reflectance spectrophotometry) or by central saturation measurements. Use of pulse oximetry is sensitive in detecting endobronchial intubations, and may be used to titrate supplemental oxygen, as determined by the Hb-O2 dissociation curve [10-12].
Carboxyhemoglobin
Carbon monoxide has an affinity for Hb that is 200 times greater than that of oxygen leading to displacement of oxygen from Hb and COHb formation. Normally, levels of COHb from environmental emissions are 1-2% and may reach 5-8% in smokers. COHb absorbs light at 660nm identically to the absorption by HbO2, and may be mistaken by the photo detector for HbO2. The arterial oxygen saturation SaO2 does not suffer from this sampling error and in the absence of a CO-oximeter, should be used to measure the oxygen saturation in these patients. Using the SaO2, it is possible to quantify the level of COHb by the pulse oximetry gap. Pulse oximetry gap= SpO2-SaO2= COHb level.
Methemoglobin
Methemoglobin is another means of spurious oxygen saturation measurement. MetHb is Hb in its oxidized form characterized by conversion of the iron moiety from the ferrous to the ferric form Fe2+→ Fe3+, a confirmation that affords significantly reduced oxygen carrying capacity. MetHb causes a decrease in both SpO2 and SaO2. The SpO2 is typically overestimated and rarely falls below 85% despite larger reductions in SaO2. Specialized monitors should be used for measuring patients at risk for MetHb such as patients exposed to benzocaine, prilocaine and high concentrations of nitrates [13]. Treatment with methylene blue may lead to transient and artificial drops in SpO2 due to its deeply blue color, which affects light absorption/transmission [13,14].
End-Tidal CO2 Monitoring
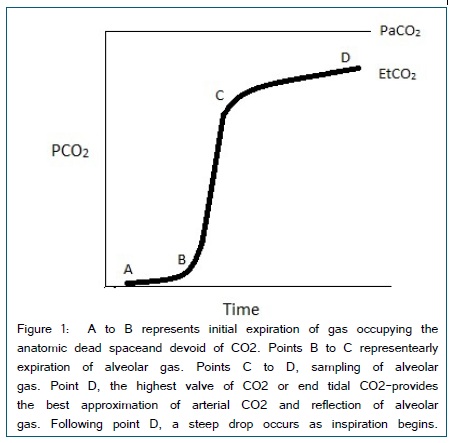
Capnography is a standard monitor for intubated and non-intubated patients in the operating and procedural rooms and is increasingly used in critical care and emergency medicine. Demonstration of the persistence of end tidal CO2 greatly reduces the risk of undiagnosed esophageal intubations [15]. Updated guidelines for cardiac resuscitation now include the use of capnography to assess the quality of chest compressions and the return of spontaneous circulation [16]. Devices for non-invasive ventilation such as the nasal cannula and standard facemask may be designed to incorporate capnography for continuous monitoring of patients in many settings. Commercially available monitors generally use infrared absorptive spectroscopy, which analyze and quantify CO2 molecules based on absorption of emitted light. Data can be displayed as a number in mmHg and as a continuous waveform [Figure 1].
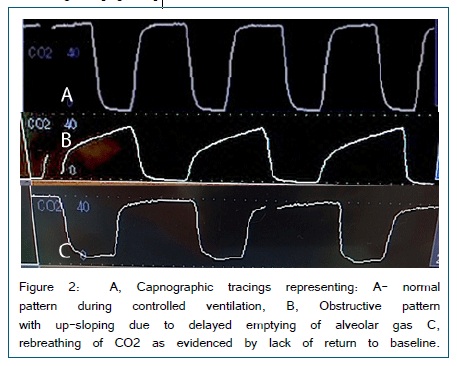
Spikes of CO2 occur with exhalation and can therefore provide a respiratory rate. Examination of the waveform provides a tremendous amount of clinical information such as the ability to identify obstructive patterns, circuit leaks, rebreathing etc. [Figure 2].
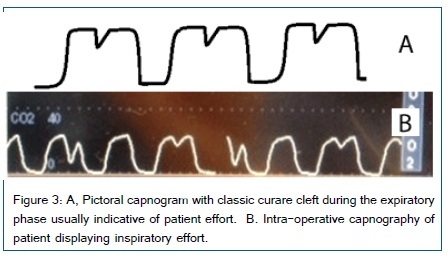
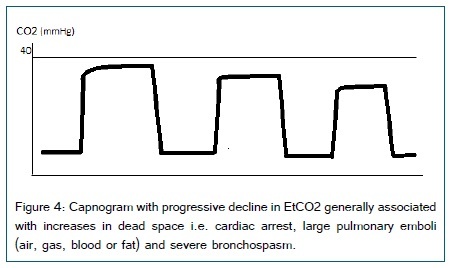
Normal End tidal CO2 values are 40mmHg ± 5mmHg and vary with disease, especially in patients with chronic obstructive lung disease and those with respiratory muscle weakness. Sampling from a closed system i.e. endotracheal tube is more accurate. Sampling from open systems, such as nasal cannula with CO2 capability are subject to dilution from ambient gases as well as the patients breathing mechanics. Aside from assessing ventilation, the characteristics of the capnography waveform provide assessment of respiratory mechanics. CO2 production is determined by metabolic rate and oxygen consumption, and affected by commonly used medications: opioid analgesics, benzodiazepines, sedatives, amphetamines, psychotropics and disease states that affect the rate and depth of breathing such as: anemia, anxiety, sepsis, metabolic derangements, overfeeding (TPN),thyroid disease etc. Expiratory flow patterns in COPD, obstructing tumors and diseases affecting the muscles of respiration are readily apparent and can aid diagnosis and management. In assessing patients ready to be weaned from mechanical ventilation, progressive increases in CO2 may signify the inability to sustain adequate work of breathing. In contrast, appearance of inspiratory effort during exhalation can signify the need for increased sedation or muscle relaxation (Figure 3). Intra-operatively, progressive decline in CO2 may be preceded by decreased cardiac output eventually leading to cardiac arrest. Progressive decrease in ETCO2 reflects increasing dead space as experienced during: cardiac arrest, large pulmonary emboli (air, gas, blood or fat) and severe bronchospasm [Figure 4]. In trauma patients and during long bone repairs, decline in CO2 could be indicative of fat embolism. End tidal CO2 in the lungs is directly proportional to pulmonary blood flow and ultimately cardiac output [17]. Measurement of CO2 during cardiopulmonary resuscitation may serve as a surrogate for cardiac output and is used to assess the adequacy of chest compressions [18,19]. During chest compressions the ETCO2 should be >10mmHg and return to baseline signifies return of spontaneous circulation [16,20]. Failure to obtain and maintain ETCO2 > 10mmHg has been associated with inefficient or failed resuscitation measures [21,22].
Invasive Hemodynamic Monitors
An invasive hemodynamic monitor utilizes an indwelling catheter placed in the vascular system. These catheters can be in arteries (typically the radial, brachial, femoral or infrequently dorsalis pedis) or veins (most typically internal jugular, subclavian and occasionally femoral). Long catheters can also be threaded from a peripheral site, such as the ante-cubital vein, into the central circulation. Catheters have single or multiple lumens, may be equipped with thermistors and/or oxygen saturation sensors and pacing electrodes, and with balloon-directed technology, can be floated from the venous circulation through the right heart into the pulmonary artery. A pulmonary artery catheter contains an injection port and distal thermistor providing cardiac output by thermodilution.
Since the first description of direct measurement of blood pressure in humans by inserting plastic cannula in the brachial artery by Peterson et al. in 1949, use of arterial catheters have evolved significantly. Invasive arterial catheters are desirable in patients with hemodynamic instability, patients requiring blood pressure augmentation or frequent blood gas analysis [23].The radial artery is the most common site for cannulation; due to accessibility and relatively low complication rates [24]. A 20G cannula is inserted either by modified Seldinger technique, direct cannulation or ultrasound guidance. A modified Allen’s test may be performed to assess for collateral circulation but has a low sensitivity. Potential complications are thrombosis, arterial spasm, distal embolization, infection, bleeding and accidental drug injection.
Measurement of blood pressure requires a closed system, which on one side is attached to the patient via non-compressible tubing and on the other a fluid under pressure. The transducer is most commonly a Wheatstone bridge that converts mechanical arterial pulsations into electrical impulses displayed by the monitoring system. The transducer is zeroed to atmospheric pressure commonly at the level of the right atrium although other sites such as the circle of Willis may be chosen. For surgical procedures in the sitting or beach chair positions or those involving intracranial aneurysms, zeroing the transducer at the atrial level will not reflect cerebral perfusion pressure as closely as if zeroing occurred at the circle of Willis and has been associated with increased post-operativene urologic insult [25-27].
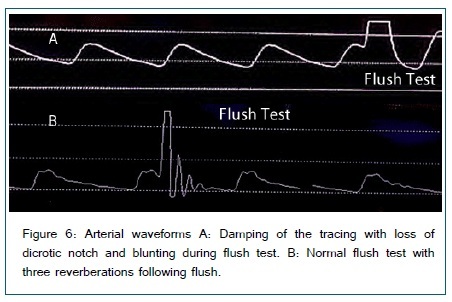
Damping is a phenomenon where the amplitude of oscillations is reduced. The length of the non-compressible tubing should be short to minimize damping. Clots, air bubbles and loose connections can cause damping. Damping is tested by a fast flush test and assessing the waveform [Figure 6]. A square wave should form with return to normal oscillations quickly. Slanting of the wave or oscillations at the end will show under or over damping. Low flow states may subject the system to clotting or difficulty obtaining adequate pulsations for interpretation. Overdamping results in underestimation of the systolic blood pressure while an underdamped system may overestimate the systolic pressure. Mean pressures should be unaffected by damping as the AUC stays the same.
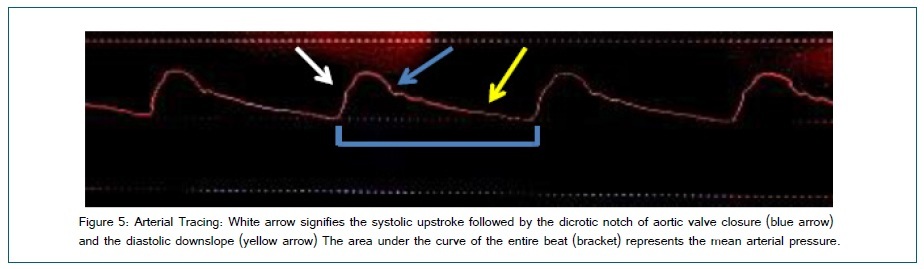
Measuring cardiac output by thermodilution is performed by injecting a bolus of room-temperature saline. Slow flow produces a shallow, spread out temperature drop, while rapid flow produces a fast downward spike that rapidly returns to normal. The shape of the waveform is used to calculate cardiac output [Figure 5]. Patients with rapid fluctuation in temperature as experienced during weaning from cardiopulmonary bypass or during states of sepsis may display inaccurate results. Catheters can now perform automated thermodilution using a thermally active metallic coil near the distal end, which measures changes in temperature over small blood volumes. Simultaneous calculation of thermodilution and dye dilution can also be used to calculate extravascular lung water.
Central Venous Catheters and Central Venous Pressure (CVP)
A central venous catheter (CVC) terminates at or close to the heart in one of the great vessels and is used for infusion, withdrawal of blood, or hemodynamic monitoring. A CVC can be used to monitor both pressure and central venous oxygen saturation ScvO2. Most commonly, internal jugular or subclavian veins are used for a central venous catheter. Waveform analysis is also possible.
CVP should be measured in the supine position, at the base of C wave, in end expiration without positive end expiratory pressure. The normal CVP in a spontaneously breathing patient is 0-5mmHg. In mechanically ventilated patients, 10mmHg is considered the upper limit, although the impact of pleural pressure on measured intravascular pressures is patient specific.
Static measures of CVP do not help in determination of patient fluid status. Dynamic changes in CVP (increase following a fluid bolus) may help with determination of fluid status, but is controversial and difficult to achieve reliably outside of paralyzed patients with regular respirations [28].
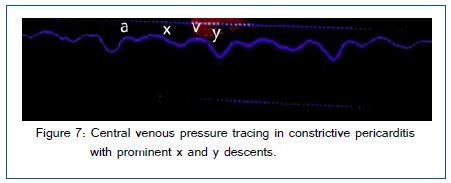
CVP waveform analysis can help diagnose several other conditions as well (a prominent V wave in tricuspid regurgitation, prominent x and y descents in constrictive pericarditis and absent or damped y descent in cardiac tamponade) [Figure 7].
Central venous oxygen saturation (ScvO2) is an additional marker, which can be monitored continuously with a special oximetric catheter, or intermittently. ScvO2 estimates SvO2 and is considered a marker for adequacy of oxygen delivery. It was part of early goal directed therapy for sepsis but the recent PROCESS trial has failed to show any clinical difference in patients with sepsis [29]. Use of venous oxygen saturation is discussed in greater detail in the section on mixed venous oxygen saturation.
Cardiac Output Monitoring
Accurate measurement of cardiac output is essential in the management of critically ill patients and assessment of oxygen delivery.There are several methods for cardiac output measurement, either direct or indirect by determination of stroke volume. Direct measurement (cardiac catheterization/Fick principle), indirect Fick principle (using CO2) and indicator dilution (thermodilution, dye) all measure cardiac output. Stroke volume can be measured by Ultrasound/Echocardiography, pulse wave contour analysis and by thoracic bioimpedance.
Pulse Contour Analysis
Originally described in 1904 by Erlanger and Hooker, this method of estimating stroke volume by pulse contour analysis has evolved since the early 1980s [30]. In 1983, Windkessel published the area under the curve method for measuring the stroke volume [31].
Several proprietary systems are commercially available [Table 1]. These systems can be divided into two categories. The first is based on measuring area under the systolic portion of arterial waveform and calculating the stroke volume mathematically. The second calculates stroke volume by looking at standard deviation of pulse pressure and effect of vascular tone on pulse morphology and comparing it to a proprietary hemodynamic database.
| Manufacturer | Model | Method |
| Phillips® | CCO/CO module | Thermodilution |
| Edwards Lifesciences® | Vigilance II® | Swan-Ganz based oximetry or thermodilution |
| Edwards Lifesciences® | Vigileo® | Arterial waveform analysis- Pulse contour analysis |
| LiDCO Ltd® | LiDCO® | Peripheral Artery catheter-(Lithium indicator dilution) |
| Deltex Medical ® | dxcvzx | Esophageal doppler probe (flow-time velocity calculation) |
| Pulsion Medical Systems® | PiCCo® | Modified thermodilution (trans pulmonary) |
| Cheetah Medical ® | NiCOM® | Bioimpedance technology (transthoracic) |
| Edwards Lifesciences® | Nexfin® | Bioimpedance peripheral wave form analysis (transcutaneous) |
| Imacor Inc® | hTEE® | Miniaturized Ultrasound (transesophageal) |
Table 1: List of commercially available devices for continuous cardiac output monitoring and method of sampling technology.
These systems perform well compared to thermodilution and are safer compared with pulmonary artery catheterization. Arterial pressure based cardiac output systems provide valuable information regarding fluid responsiveness using variables such as SVV (stroke volume variation). Similar information regarding fluid responsiveness can also be obtained simply from the arterial tracing using pulse pressure variation but lacks cardiac output and therefore the ability to make oxygen delivery (DO2) determinations.
Disadvantages
Although arterial waveform analysis is dependent on several assumptions and several variables are calculated, which may lead to error, comparison to thermodilution CO or echo has been excellent [32]. The ability to assess volume responsiveness using stroke volume variation is lost with spontaneous breathing and during low tidal volume ventilation < 8 cc/kg [33]. With significant cardiac arrhythmias such as atrial fibrillation, variation in stroke volume is related to the varying R to R interval and not volume fluctuations. However, algorithms exist to separate out the variation caused by the pleural pressure change of positive pressure ventilation from that of the cardiac rhythm although they have not been experimentally validated in patients. Finally, if the arterial waveform is unreliable, these systems cannot provide accurate cardiac output data. Aortic regurgitation and the use of intra aortic balloon pumps also interfere with accurate CO determination.
Reliability
There are several studies comparing the CO measurement using PAC with arterial waveform analysis derived CO. The majority of these studies were performed in patients undergoing cardiac surgery but also include other clinical conditions. Although absolute values of CO are different depending on the system used and conditions; disease state, OR vs. ICU, evaluated experimentally; the data is reliable and the trends in direction of change allow accurate interpretation and therapy of oxygen delivery [28].
Use in Assessing Volume Responsiveness
The clinical question asked prior to giving fluids to vulnerable patients is simply; what is the impact on Cardiac Output and Oxygen Delivery. The ability to predict this ahead of time allows physiologic treatment of volume status and avoids inappropriate volume loading.
Respiration causes changes in intra-thoracic pressures leading to changes in stroke volume. Change in stroke volume over time is stroke volume variation or SVV. Reuter et al. [34] found that SVV reliably decreased as cardiac index increased in response to colloids in ventilated postoperative cardiac surgical patients. The amount of SVV can be used to predict preload responsiveness in the other conditions. In a meta-analysis of 29 studies, Marik found that dynamic variables such as SPV, PPV and SVV were better in predicting changes in cardiac/stroke index in response to a fluid challenge than static variables [35]. Additionally, withholding fluids in patients with elevated CVP or PCWP is equally problematic on a physiologic basis. Interestingly this is predicted from the well-known Frank Starling mechanism and the cardiac function curves that define individual physiology.
Swan-Ganz Catheters
The creation of the flow-directed PA catheteris credited to Drs. Swan and Ganz [36]. PA catheters have been used in patients starting in the early 1970s and are still used, although less frequently, in many centers today [37]. The PA catheter is a multi port system that allows for measurement of multiple pressures such as CVP, RAP, RVEDP, PAP and PCWP; flow CI, CO and SV in addition to blood sampling for mixed venous oxygen and central venous oxygen saturation and provides continuous core temperature measurement. Multiple calculations can be extrapolated from this data and when used appropriately, the PA catheter can serve as a resource for evaluation of cardio-pulmonary function and oxygen utilization. One concept of the PA catheter is that if wedged in the pulmonary capillary, during diastole (when the mitral valve is open), the LVEDP = LAP= PCWP as they are contiguous. This premise is subject to numerous pitfalls such as alterations in pulmonary pressures, use of PEEP, cardiac shunts and or mitral valve dysfunction. Cardiac output can be measured by the thermodilution method via the thermistor located just proximal to the tip or continuously by a thermal-filament. Modules allow for continuous evaluation and display of: CO, CI, SvO2, EDV, SVR, RVEF and SvO2.
Use of a PA catheter may also be helpful in differentiating the various shock states. However, PA catheters are not without risk. There is a risk of infection with any indwelling line, as well as damage to cardiac and vascular structures and potential for inducing a right bundle branch conduction block. The two most critical pieces of information available with a pulmonary artery catheter are the pulmonary artery occlusion pressure (PAOP) and the cardiac output (CO). As PAOP is not a reliable indicator of preload, and since less invasive means exist for determining cardiac output, there has been a trend towards less frequent use of pulmonary artery catheters [37]. Lack of patient benefit has accelerated this trend although an outcome benefit of a diagnostic as opposed to therapeutic procedure is a large hurdle to overcome.
Mixed Venous Oxygen
Mixed venous oxygen saturation (SvO2): Mixed venous blood is obtained by sampling from the pulmonary artery and provides an excellent measure of the balance between oxygen utilization and delivery to tissues. Mixed venous blood is extracted from the pulmonary artery encompassing pulmonary venous return after mixing with the heavily deoxygenated coronary sinus blood. Mixed central venous blood is obtained by aspiration from a central line at the superior vena cava/right atrial junction and occurs prior to the return of blood from the coronary sinus. There is a debate as to whether ScvO2 may serve as a surrogate for SvO2 as indwelling central lines are more commonplace when compared with pulmonary artery catheters [38,39]. Trending ScvO2 in the critical care setting may provide an acceptable surrogate for SvO2 [40].
Mixed venous oxygen saturation (SvO2) = SaO2- (VO2/CO x Hb x 1.39) normal 65-75%
Mixed venous saturation is directly proportional to arterial oxygen saturation, cardiac output and hemoglobin concentration and inversely proportional to oxygen consumption. Whole body oxygen extraction is typically around 25-35%
providing a normal range for SvO2 of 65-75%, although organ specific oxygen extraction varies. When O2 utilization exceeds delivery, tissues switch to the highly inefficient system of anaerobic metabolism for cellular energy creation indicative of cellular hypoxia and impending cell death. Clinical signs of inadequate oxygen delivery are evidenced by end organ dysfunction occurring late in the disease process making early goal directed therapy using continuous SvO2 monitoring an attractive monitoring tool [41].
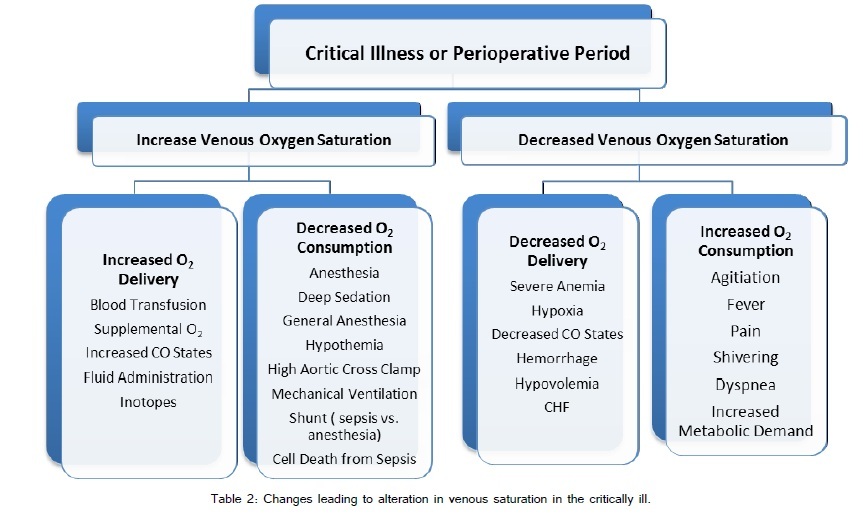
Differences in oxygen extraction are related to individual tissue metabolism and blood flow. Cardiac cellular oxygen extraction is around 40-75% for example whereas the kidneys extract less than 10%. Increased oxygen consumption is normally compensated by increases in cardiac output. In many clinical states, either this is not possible or the compensation is exhausted. During physiologic stress/hypoxia, cellular adaptation allows for greater extraction of oxygen and therefore lower SvO2. Alternatively, high SvO2 may indicate the inability of cells to increase extraction or utilize oxygen. A multitude of clinically encountered situations influence SvO2 and are summarized in Figure 6 [42]. One of the main areas of interest in the use of mixed venous oxygen saturation is during shock states. Rivers et al. [41] identified mixed venous saturation as a key component in the early treatment of shock patients. Mixed venous oxygen saturation is part of the Early Goal Directed Therapy protocol used to guide treatment according to the Surviving Sepsis Campaign [43]. The predicted changes in SvO2 observed during various shock states are highlighted in table 2). Rivers et al. [44] noted that during cardiopulmonary resuscitation, ScvO2 of greater than 72% was 100% predictive of return of spontaneous circulation while patients in which ScvO2 did not raise above 30% during CPB did not have a successful resuscitation.
Alternative Ways of Measuring Cardiac Output
The Fick Principle remains the “gold standard” for the determination of cardiac output. In the 1870s, Adolf Fick described that the uptake or release of a substance (O2 in this case) is proportional to the flow through that organ and the arterial venous difference. If applied to the lung, the oxygen consumption = cardiac output x (A-v) O2 difference.
Cardiac Output by A-v O2 Difference: CO = VO2/arterialO2-venousO2
The Dye-dilution method is an outmoded way of determination of CO described over a century ago. A concentration of dye was injected into the bloodstream. After adequate equilibration time for mixing, samples continuously drawn were examined for the concentration of the dye. Through a series of calculations, cardiac output could be extrapolated.
Real Time Continuous Dynamic Measurements (PPV, SVV, PVI)
Numerous devices are available that provide continuous hemodynamic monitoring for patients in the ICU and operating rooms (Table 1). Analysis of arterial and plethysmographic waveforms allow for determination of stroke volume and pulse pressure variability respectively. Positive pressure ventilation has effects on left and right ventricular performance. During a positive pressure breath, the left ventricle is afforded increased preload from displaced pulmonary capillary blood. The increase in intra-thoracic pressure decreases the left ventricle after load resulting in an increase in left ventricle stroke volume. Simultaneously the right ventricle suffers an initial drop in preload due to increased intra-thoracic pressure. Additionally, RV after load increases with each positive pressure breath, leading to an acute decrease in right ventricle stroke volume. This diminished stroke volume ultimately arrives at the left side of the heart. These varying stroke volumes create the stroke volume variability induced by positive pressure ventilation. Variability is magnified in volume depleted patients. As volume resuscitation ensues, the ventricles are less subject to the effects of positive pressure ventilation decreasing variability. Reduction of variability may signal providers that volume resuscitation is adequate and failure of response may trigger additional therapies to augment DO2. A detailed guide for goal directed therapy-using SVV has been suggested by McGee WT [33].
The NexFin (Edwards Irvine, CA) is a non-invasive system that provides beat-to-beat measure of cardiac output. NexFin utilizes an inflatable finger cuff to measure arterial pressure and determines stroke volume by the pulsatile systolic area of each beat, using impedance. Broch et al. [45] found that the Nexfin system provided a reliable method of cardiac output determination when compared with more invasive monitoring using thermodilution methods in patients undergoing cardiac surgery.
Plethysmographic variability index (PVI) has also been proposed as a continuous measure of volume responsiveness with higher values corresponding to greater responsiveness. Examination of the plethysmographic tracing using a modified pulse oximeter probe allows for determination of the perfusion index. Perfusion index (PI) is a numerical value that is determined by the strength of the infrared signal detected. The strength of the signal correlates with the amount of volume at the sample site. Changes in the index may suggest regional changes in volume status. Perfusion index has been used to assess changes in flow during induction of anesthesia and following epidural placement. It has been suggested as a measure of volume status that can be continuously sampled in ICU patients, especially following preload challenges. Pitfalls include peripheral temperature changes, low flow states from shock or severe peripheral vascular disease as well as effects of spontaneous ventilation [46,47].
Plethysmographic variability index %= [(PImax-PImin)/ PImax] x100%
Esophageal Doppler Monitoring: a thin probe that is inserted into the mid-esophagus and measures the flow velocity in the descending thoracic aorta. The system assumes the patient’s aortic cross sectional area (CSA) using normograms as determined by height, weight and age. The product of CSA and flow velocity produces stroke volume and when adjusted for heart rate provides a cardiac output. Esophageal Doppler has been validated against the pulmonary artery catheter [48-50]. Limitations include sampling errors via placement issues as well as the minimally invasive nature of esophageal intubation. Additionally, the device may be poorly tolerated by the awake patient.
The non-invasive cardiac output monitor, NICOM (cheetah medical) utilizes transthoracic bioimpedance technology for cardiac output determination [51]. Surface electrodes applied to the chest emit current whose amplitude is altered by the pulsatile arterial flow in the thoracic aorta. The amplitude of the current wave is changed as well as the timing of the current waveform termed a phasic shift. The phasic shift is related to the arterial flow or stroke volume. The device converts the difference in emitted and returned current into a stroke volume. Individual patient parameters affecting sampling are taken into account in the form of body surface area. The general idea is somewhat similar to the doppler shift measured by echocardiography assessing the impact of flow on emitted and returned waves. The advantage of bioimpedance technology is the complete non-invasive nature of measurement. Waldron et al report similar outcomes in patients following colorectal surgery when guiding goal directed therapy using bioimpedance technology compared with esophageal Doppler monitoring [48]. Similarly, Marqué S et al. [52] demonstrated reasonably comparative measures of cardiac output when comparing pulse wave contour analysis with bioimpedance technology ina small subset of patients following cardiac surgery.
Many of the newer non-invasive monitors account for patient parameters and determine the cardiac and stroke volumes and indices based on the body surface area. In most patients, this probably provides an excellent means of comparison, however, in patients at the extremes of body surface area, the accuracy of these indexed values may come into question [53-55].
Imaging in Hemodynamic Monitoring
Chest Radiography
Chest radiography performed routinely in the critical care unit. Signs of fluid overload, curly B lines, cephalization of pulmonary vessels, and development of pleural effusions are not well validated. Radiography suffers from a delay in insult to visualizability and does not provide a continuous assessment. Serial examinations may be useful in determining response to treatment over a prolonged hospital course.
Ultrasound
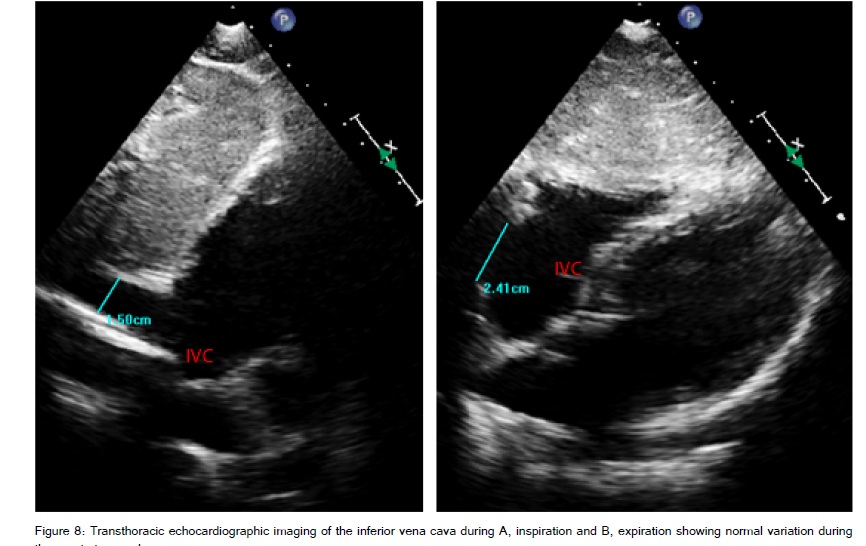
Portability and improved imaging quality has led to the increasing use of ultrasound in the ICU. Bedside scanning provides the clinician with rapid and real time determinants of volume status, cardiac function and may identify issues such as pleural or pericardial effusions leading to improved diagnostic accuracy and treatment of ICU patients [56]. Ultrasound of the inferior vena cava has been used as a measure of volume status and predictor of volume responsiveness.
The IVC can be examined at the bedside for width and respiratory collapsibility. A sub costal view with or without M –mode is used to obtain cyclic changes in IVC diameter [Figure 8]. Obtaining the maximum inspiratory diameter and minimum expiratory diameters during normal tidal volume ventilation, it is possible to assess volume status by the distensibility index. The IVC diameter can be measured with a caliper. Measurements of < 2cm with an inspiratory collapse of >50% correlate with intravascular volume depletion while measurements >2cm with an inspiratory collapse of < 50% suggest fullness are a sign of adequate volume or inability of the heart to accept volume [57]. A simple leg raise can transiently and reversibly increase preload and may be used as a surrogate for a fluid bolus.
Distensibility Index: (IVCmax – IVCmin)/( IVCmax) x100= DI %
Distensibility Indices > 18% identified fluid responsive patients compared with non- responders with both a sensitivity and specificity of 90% [58].
Echocardiography
Transthoracic Echocardiography (TTE)
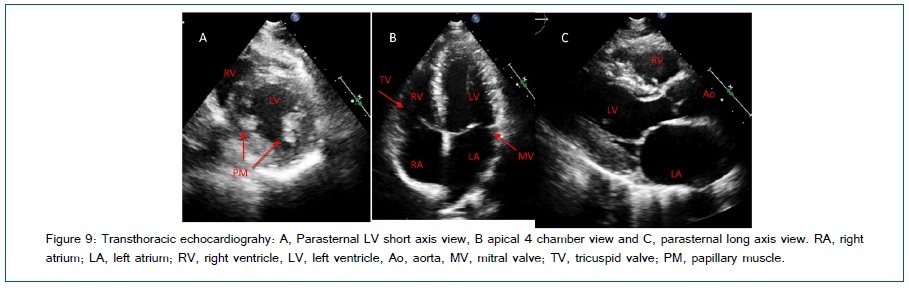
A quick bedside exam can be a useful tool in the differentiation of disease processes. Some basic skills are required for assessment and detailed analysis requires both adept acquisition windows by a sonographer and a thorough interpretation. Imaging the heart may be accomplished by obtaining a few key views. Several methods of basic scanning protocols have been proposed. The Focused Assessed Transthoracic Echo (FATE) protocol uses 4 basic views that allow for rapid identification of major causes of hemodynamic compromise [59]. Basic TTE views include; sub costal 4 chambers (not shown), apical 4 chambers, parasternal long axis and parasternal LV short axis (Figure 9). Views of the IVC are easily obtained by rotating the probe 90° from the subcostal 4 chamber view. A phone application is available for ease of reference at bedside. A novice sonographer can easily acquire the skill such that basic diagnostic information could be obtained and interpreted in real time. Manasia et al.
[60] demonstrated that with 10 hours of training, intensivists were able to perform and interpret basic images and obtain information assisting diagnosis and management. Obtaining a few basic views, a clinician could easily identify pericardial orpleural effusion, assess volume status, assess global RV and LV function and or ischemia, and identify any major valvular abnormalities or intra-cardiac obstructions as a cause of hemodynamic compromise. Looking at the ventricle, it is possible to make a general assessment regarding ejection fraction as well as volume status. Finally, the ability to interrogate a valve using continuous wave or pulsed wave Doppler is useful in the setting of severe stenotic or regurgitant lesions. The limitations of transthoracic imaging include the operator dependent nature of the scan and the inability to obtain adequate windows due to patient habitus or positioning limitations.
Transesophageal Echocardiography (TEE)
Transesophageal echocardiography is not thought to be a traditional monitoring device. Usually TEE is obtained by a sonographer and interpreted at a later time by a cardiologist. This may be changing with the advent of continuous, disposable miniaturized transesophageal (mTEE) echo probe by Imacor Inc. (Garden City, NY). The miniaturized probe allows assessment of LV function and filling through three views: mid esophageal 4 chambers, transgastric short axis and superior vena cava. Early studies using the mTEE report ease of use, however, further outcomes analysis is required [61]. A basic TEE exam relies on 20 standard views for assessment of global ventricular function, volume status, and interrogates the valves, aorta, pericardium and pleura ,[62]. While standard TEE may be extremely useful in acquisition of quality images for hemodynamic assessment, it’s more invasive nature and requirement for significant imaging training limits its use as a routine hemodynamic monitor. Detailed TEE discussion is beyond the scope of this review.
Application of Hemodynamic Assessment Tools; Putting it All Together
The purpose of the various modalities of hemodynamic monitoring is to provide an assessment of volume status, cardiac function and to guide individualized treatment. Additionally, clinicians use these tools for optimization of oxygen delivery and utilization [63].
Oxygen Transport and Delivery
Oxygen is carried in the blood in two ways, bound to hemoglobin and dissolved in plasma. The majority of oxygen is transported bound to hemoglobin with a minimal amount dissolved in plasma. The fraction of oxygen bound to hemoglobin is given by the equation:
Oxy-Hemoglobin Content: HbO2= 1.34ccO2/gm x Hb (gm) x SaO2
Total arterial blood oxygen content also accounting for the percentage of dissolved oxygen is given by equation:
Arterial Oxygen Content: CaO2= (1.34 x Hb x SaO2) + (0.003 x PaO2): Normal 200mL/L
Total venous blood oxygen content is given by equation:
Venous Oxygen Content: CvO2= (1.34 x Hb x SvO2) + (0.003 x PvO2): Normal 150mL/L
The delivery of oxygen is the combination of the arterial oxygen content and blood flow (CO) given as Delivery of Oxygen (DO2) = CO x CaO2: Normal 900-1,100 mL/min
The uptake of oxygen is measured as the difference between the arterial and venous oxygen content (Fick Principle). Since tissues do not store oxygen, the difference of oxygen sent from and returning to the heart or the a-v O2 difference is equivalent to the oxygen consumption (VO2).
Oxygen Consumption: VO2 =CO x (CaO2- CvO2): Normal 250mL/min
The oxygen extraction ratio is the ratio of the amount delivered to the amount consumed, with normal values generally around 25%-30%.
Oxygen Extraction Ratio: O2ER= VO2/DO2
The body has the ability to adjust oxygen extraction during states of shock. Extraction can reach as high as 50-60% to compensate for decreases in delivery. During shock, as delivery decreases, the body reaches a critical threshold where oxygen consumption is directly related to delivery [64]. At this point, anaerobic metabolism predominates and organ failure occurs. It is prior to this occurrence where intervention is crucial and potentially lifesaving.
Hemodynamic Parameters
The following hemodynamic parameters are obtained via a variety of clinically available modalities highlighted above. Cardiac output is an important indicator of perfusion and the means of oxygen transport to the periphery. The values of cardiac output and stroke volume are often indexed to body surface area as a means of comparison between patients.
Cardiac Output, CO= HR x Stroke volume- normal 5-6 L/min
Cardiac Index, CI= CO/BSA 2.4-4.0 L/min/m2
Stroke volume, SV= CO/HR
Stroke Volume Index SVI= SV/BSA= 40-70 mL/beat/m2
Systemic Vascular Resistance, SVR= 80 x (MAP-RAP)/CO
Pulmonary Vascular Resistance, PVR= 80 x (meanPAP-PCWP)/CO
As shock states are among the most common reasons to assess hemodynamic changes, the classical alterations in shock states are summarized in table 3.
| Classic Hemodynamic Changes Associated with Shock States | ||||||||
| Shock States | SVR | PVR | CI | SvO2 | RAP | RVP | RAP | PAOP |
| Cardiogenic | ↑ | N | ↓ | ↓ | ↑ | ↑ | ↑ | ↑ |
| Distributive | ↓ | N | N/↑ | N/↑ | N/↓ | N/↓ | N/↓ | N/↓ |
| Hypovolemic | ↑ | N | ↓ | ↓ | ↓ | ↓ | ↓ | ↓ |
| Obstructive | N/ | ↑ | ↓ | N/↑ | ↑ | ↑ | ↑ | N/↓ |
Table 3: Expected changes to classic hemodynamic parameters in shock states.
Incorporating newer modalities of hemodynamic assessment discussed in this paper we have proposed the following update of this more traditional assessment [Table 4].
| Shock State | Cardiac Output/Stroke Volume | Systemic Vascular Resistance | Conventional Preload Measures (CVP/PAOP) | Stroke Volume Variation/Pulse Pressure Variation |
| Cardiogenic | Low | High | High | Low |
| Distributive (Sepsis) | Variable pre-resuscitation/ High adequately resuscitated | Low | Low | High pre-resuscitation/ Low adequately resuscitated |
| Hypovelmic | Low | High | Low | High |
| Obstructive | Low | High | High | High |
Table 4: Expected changes in static and dynamic hemodynamic measures for the shock states.
Augmentation of oxygen delivery, preload, after load and cardiac contractility are all possible using a variety of pharmacologic and non pharmacologic therapies and are beyond the scope of this paper. Using physiologic data to inform treatment provides assurance that optimal individualized care is being provided to our patients.
Funding
None
References
8. Sinex JE (1999) Pulse oximetry: principles and limitations. Am J Emerg Med 17: 59-67.
16. http://www.heart.org/idc/groups/heart-public/@wcm/@ecc/documents/downloadable/ucm_317350.pdf
20. Marino PL (2007) The ICU book. 3rd ed. Philadelphia: Lippincott Williams and Wilkins
51. http://cheetah-medical.com/sites/default/files/nicom-how_bioreactance_works.pdf