Research Article
Authors: R. Zhurbenkoa*, D.R. Viera-Oramasa, T. Lobaina-Rodrígueza, G. Castro-Escarpullib, M.G. Aguilera-Arreolab, C. Rodríguez-Martíneza
1 National Center of Biological Products, Bejucal, Mayabeque, Cuba
2 Medical Bacteriology Laboratory, Microbiology Department, National School of Biological Sciences-National Politechnical Institute. Mexico D.F., Mexico
Corresponding author
PhD. Raisa Zhurbenko
Address:Carretera a Beltrán, km 1 ½, Bejucal, Mayabeque 32600, Cuba.
Tel: (53) 047 68 24 41;
E-mail: raisa@biocen.cu;
Received Date: 12th September 2016;
Accepted Date: 12th June 2017;
Published Date: 22nd June 2017
Citation
Zhurbenko R, Viera-Oramas DR, Lobaina-Rodríguez T, Castro-Escarpulli G, Aguilera-Arreola MG, et al. (2017) Evaluation of A New Detection and Quantification Method of Total Coliforms and Escherichia coli in Water. Enliven: Microb Microbial Tech 2(2): 001.
Copyright
2017 Dr. Raisa Zhurbenko. This is an Open Access article published and distributed under the terms of the Creative Commons Attribution License, which permits unrestricted use, distribution and reproduction in any medium, provided the original author and source are credited.
Abstract
The discovery of chromogenic and fluorogenic substances for their application in tests has brought about huge advantages over the use of tests based on traditional culture media. In the field of drinking water microbiology, many studies are addressed at reviewing methods of analysis of coliform bacteria and Escherichia coli. The main objective of this study was to evaluate a new method of detection and quantification of total coliforms and E. coli in water by the Most Probable Number (MPN) technique using as broth culture a chromogenic-fluorogenic medium (CCL) according to the fundamental aspects of the validation guidelines of qualitative and quantitative methods of AOAC International and the standard ISO 16140 by analyzing 99 water amples from different origins. The new method is based on the splitting of specific substrates for glucuronidase and tryptophanase activity by E. coli, and for β-galacosidase by E. coli and coliform bacteria, and also on the gas production by the coliform group. A method described by ISO 9308-3 was choosed as reference, which is based on the fermentation of lactose with acid production, on the oxidase-negative character of total coliforms (for confirmation) and, additionally, on the production of indole from tryptophan at 44°C (E. coli confirmation). By different validation methodologies of alternative methods it was proven that the new chromogenic fluorogenic method using the Most Probable Number, employing methylumbelliferyl-β-D-glucuronide and ortho-nitrophenyl-β-D-galactopyranoside as enzymatic markers for the detection and counting of coliforms and E. coli, is equivalent to the procedures described in the ISO reference method for the same purpose in terms of diagnostic accuracy and precision of the count. The composition of the culture medium used allowed for the correct determination of the target microorganisms. The new procedure allowed obtaining results in less time, with less reagents, and more easily.
Keywords
Water; Coliform; E. coli; β-D-galactosidase; β-D-glucuronidase; Rapid detection
Introduction
Presently, in the world, the use of alternative reference methods of water and food analysis becomes more important. The discovery of chromogenic and fluorogenic substances for their application in tests has brought about huge advantages over the use of tests based on traditional culture media. In the field of drinking water microbiology, many studies are addressed at reviewing methods of analysis of coliform bacteria and Escherichia coli [1-12]. Herrera and Suarez (2005) [13] reported that fecal coliforms and enterococci are the most appropriate indicators for the presence of fecal contamination, as they are ubiquitous and able to stay for long periods of time in water as well as in tropical and subtropical soils (see also, Fujioka et al., 1999) [14]. Considering E. coli as an indicator of fecal contamination requires the introduction of new methods for the rapid identification of the species of microorganisms, such as that based on 4-methyllumbelliferyl-ß-D-glucoronide (MUG) [15].
In the National Center of Biopreparations (Cuba), a group of researchers has developed chromogenic and fluorogenic media for detection and enumeration of total coliforms and E. coli [16-19]. These culture media and methods proposed were evaluated by various researchers in different applications [20-24].
Council Directive 98/83/EC of the European Union (November 3, 1998) [25] establishes to set concrete official analysis methods for microbiological-type parameters. Reference methods are those that are internationally recognized and widely accepted. Examples of these methods are published in: Standard Methods for the Examination of Dairy Products (official methods in the USA), published by the American Public Health Association (APHA), Environmental Protection Agency of the USA, Food Safety Inspection Service, Department of Agriculture, Compendium of Methods for the Microbiological Examination of Foods [26]; Official Methods of Analysis of the internationally based Association of Official Analytical Chemists AOAC [27]; Bacteriological Analytical Manual of the Food & Drug Administration of the USA (FDA), American Association of Cereal Chemists (AACC) [28].
These methods, in general, correspond to International Organization for Standardization (ISO) standards, and specifically for the case of coliform bacteria and E. coli exists the ISO 9308-1:2000 [29]. Some of these methods are cumbersome, sometimes expensive, and may require several steps to achieve reliable counts with verified identifications. Furthermore, achieved time reductions do not meet yet the needs of laboratories and end users. For these reasons, the search continues for alternative methods that accelerate results, reduce costs, facilitate the work, and diminish material burden. These alternative methods can be used provided that a performance study shows that their results are equivalent or superior to the official reference methods. These procedures should facilitate the execution of the tests, save manual labor, decrease waste, facilitate interpretation of results, and preferably increase specificity. Indeed, enzymatic reactions allow for the analysis of more samples. However, among the disadvantages of a method to detect a microorganism by an alternative method, such as the presence/absence (P/A), is that it is still considered only as a screening test, requiring confirmation of positive results by the traditional method. When a new method does not require confirmation, it should be validated under a protocol officially recognized at the national or international level.
Checking, comparing and validating alternative methods is essential for the user, as well as for the company or laboratory that develops them. Although, the recently published ISO 16140:2003 [30] and its 2011 amendments, present a protocol to validate alternative microbiological methods, we still have not reached a global agreement - there are different protocols, depending on whether they are defined by ISO, AOAC International or NordVal. Some studies estimate a growth of 17% of annual sales of kits for alternative methods, compared with 8% of the traditional methods in Latin America. The development of alternative methods will continue and will be useful for surveillance of food by the health authority and by businesses, based on the conference papers presented at the Congress of Science and Food Technology, held in Cordoba, Argentina (2004) (Source: Food Emphasis Latin America, Technical Publications).
The main objective of this study was to evaluate a new method of detection and quantification of total coliforms and E. coli in water by the Most Probable Number (MPN) technique using as broth culture a chromogenic-fluorogenic medium (hereinafter CCL) according to the fundamental aspects of the validation guidelines of qualitative and quantitative methods of AOAC International and the standard ISO 16140 [30] by analyzing water from different origins.
Materials and Methods
Samples
The study period ran from February 2009 until November 2012. We obtained a total of 99 water samples from seven geographic locations distant from each other and representative of different origins: 30 samples of water from the main supply (aqueduct), 4 samples from cisterns supplied by water from chlorine-treatment plants, 36 water samples from wells and 4 samples of untreated rivers, 16 samples from chlorinated pools, and 8 samples of de-ionized water. Of these, 9 aqueduct water samples, 4 from pools, and 26 from wells were processed as follows to achieve specific pollution levels for validation purposes. They were treated with 18% sodium hypochlorite solution (from 0.1 to 0.5 mg/L) for subsequent artificial contamination with a pure culture of E. coli ATCC 25922 in Tryptone Soy broth incubated at 35ºC for 24 h. The cultures were refrigerated (2-8ºC) overnight for stabilization. They were standardized to OD550 = 0.25 corresponding to approximately 3 x 10⁸ CFU/mL in a spectrophotometer (T70 UV/VIS Spectrometer, PG Instruments Ltd., United Kingdom). Decimal dilutions were made in 0.1% (w/v) saline peptone according to the ISO 6887-1 (1999) [31]. Aliquots were taken from the 10-6 dilution and inoculated in Tryptone Soy Agar. The dilutions were stored under refrigeration (2-8°C) until the next day, when the recount results were in the plates. Finally, aliquots of 10-6 dilution were added to 1 L of water to be analyzed. Water samples were collected in 1000-mL sterile flasks, with 1 mL of 10% (w/v) sodium thiosulfate solution prior to its sterilization in the case of chlorinated water samples. Samples were transported in containers protected (isolated) from heat and temperature. Maximum transportation time did not exceed 6 h at a temperature below 10°C. Samples were processed in the laboratory within 2 h after arrival and were coded with Arabic numerals in consecutive order, both for the collected and the artificially contaminated samples. Subsequently, they were homogenized and used with their natural microbial load, likewise necessary dilutions were prepared: 1 in 10 and 1 in 100, using saline peptone 0.1% (w/v), according to APHA et al. (2005) [32]. The stability of the samples was ensured throughout the process without exposure to different temperatures, contamination from other potential sources, or other potentially damaging physical factors.
Levels of Contamination
Five levels were established for the classification of samples depending on the amount of contamination: level 0; level 1, from 1-10 CFU/100 mL; level 2, from 11 to 30 CFU/100 mL; level 3, from 31 to 100 CFU/mL; and level 4, more than 100 CFU / mL.
Procedure
Samples with possible contamination of total coliforms and E. coli were tested comparatively by the two methods: alternative (5 assay tubes) using the chromogen-fluorogene CCL [19] and the reference (5 assay tubes) using lactose broth medium (CL), brilliant green bile broth (CBVB), EC medium with MUG (ECMUG) [32]. The culture media were prepared according to Rodríguez et al. (2004) [33]. The reference method described in ISO 9308-3 [34] is based on the fermentation of lactose with acid production, in the oxidase-negative character of total coliforms (for confirmation) and, additionally, in the production of indole from tryptophan at 44°C (E. coli confirmation). ECMUG was incubated at 44.5 ± 0.2°C for 24 ± 2 h in a water bath (Gallencamp, United Kingdom). The presence of gas is characteristic for fecal coliforms and blue fluorescence at 366 nm for E. coli. Tubes where gas was not produced were considered to be negative. Agar Endo (AE) plates were inoculated from the ECMUG- CBVB-positive tubes in the confirming phase of total coliforms, fecal coliforms, and E. coli, and were incubated at 35 ± 2°C for 18-24 h. From AE up to 5 colonies per plate were selected, codifying between typical and atypical: typical (colonies with greenish metallic sheen to reflected light with dark center in the transmitted light or red) and atypical (with other features) and these were inoculated simultaneously on Nutrient Agar (NA) and Cysteine Tryptic Agar (CTA) in order to preserve them for future identification of the colony. If 1 of the 5 colonies was identified as E. coli or coliform, was considered as sufficient identification, discarding the rest of the colonies. Otherwise, we proceeded to the identification of the remaining 4 colonies to confirm the presence of E. coli or other coliforms. From a total of 1444 colonies from CBVB, 701 were identified (48.5%), and from the 718 from ECMUG, 401 (55.8%) were identified. All colonies were inoculated into culture media for biochemical tests from CTA. NA- plates were incubated for 18 to 24 h at 35 ± 2°C for Gram staining and cytochrome oxidase testing. From CTA we proceeded to inoculate the culture media with the aim of identifying the microbe: fermentation of dextrose and lactose, and production of hydrogen sulfide (Kligler Iron Agar), lactose fermentation (Lauryl Tryptose Broth), indole production, sulphydric gas, and motility at 35-37°C (SIM Medium), methyl red and Voges-Proskauer (MR-VP Medium) Simmons Citrate Agar, decarboxylation of ornithine, lysine (amino acid decarboxylation medium), fermentation of cellobiose, inositol, raffinose, sorbitol, xylose (phenol red broth ), esculin hydrolysis (Bile Esculin Agar), beta-galactosidase and beta-glucuronidase (CromoCen CC). Where necessary, additional tests of fermentation of melibiose, dulcitol, rhamnose, L(+)-arabinose, D-arabitol (Phenol Red Broth) were performed, as well as of malonate and pyrrolidonyl-beta-naphthylamide (PYR) (Oxoid Ltd., United Kingdom). Where required, biochemical tests were made with the battery of API 20E and API 20NE assays (bioMérieux, France).
CCL is a liquid culture medium constituted by a chromogenic substrate (ortho-nitrophenyl-β-D-galactopyranoside) and another fluorogenic (methylumbelliferyl-β-D-glucuronide) to determine, respectively, the activity of enzymes β-D-galacotosidase (present in coliforms) and β-D-galactosidase (present in E. coli) [19]. The broth also contains a mixture of nutrient bases specially selected, among which are highlighted peptones of different origins and extracts, inhibitors of Gram-positive microorganisms, carbon sources, buffers, and L-tryptophan for E. coli confirmation.
First enzyme activity is manifested by the appearance of yellow color in the culture medium and the second by the appearance of blue fluorescence at 366 nm. This method corresponds to new criteria for defining what is a coliform (β-galactosidase positive character) and what is E. coli (β-glucuronidase positive character) [35]. That is, the total coliform group includes Gram-negative bacilli, aerobic and facultative anaerobic, fermenting β-galactopyranoside with the production of color change to different shades of yellow within 24 h of incubation at 35 ± 2ºC. Aeromonas species can develop yellow hues, so that for samples in which their presence is suspected, the CCL broth was supplemented with cefsulodin (Fluka, Switzerland) in solution (5-10 mg/L of prepared medium). E. coli: in this method, are considered as such bacteria that ferment β-galactopyranoside with production of the color change to different shades of yellow, produce indole by the Kovac's reagent, and emit blue fluorescence when cultures are exposed to long wave UV light (366 nm) (hydrolysis of β-glucuronide) within 24 h of incubation at 35 ± 2ºC. In the medium, Gram-positive microorganisms are inhibited and the other Gram-negative microorganisms do not develop all the above described characteristics. Presumptive Phase: for total coliforms detection 5 portions of 10 mL of the test sample were aseptically taken with a pipette, and inoculated into 5 assay tubes with 10 mL of double strength CCL containing inverted Durham tubes. Five portions of 1 mL each of the 1:10 and 1:100 dilutions were taken aseptically, using a pipette, and inoculated into 5 assay tubes containing inverted Durham tubes. The tubes were incubated at 35 ± 2°C for 24 h and, after this time, growth was observed by the development of turbidity and color of the medium. Response was considered positive if there was growth, yellow color development (positive β-galactosidase reaction). For E. coli detection, in cultures from the total coliforms test, we observed the emission of blue fluorescence under UV light at 366 nm. It was considered a positive response to E. coli if there was growth, yellow color development (positive β-D-galactosidase reaction), and blue fluorescence at 366 nm (positive β-D-glucoronidase reaction). In parallel, a positive control, E. coli ATCC 25922 (MUG and indole positive) was inoculated and, as negative control, Enterobacter aerogenes ATCC 13048 (MUG and indole negative) and Salmonella Typhimorium ATCC 14028 β-galactosidase and β-glucocoronidase negative) were used. For the assessment of the inhibitory capacity of the medium with microorganisms, cefsulodin on β-galactosidase-positive microorganisms not pertaining to coliforms, Aeromonas hydrophila ATCC 7966 was used.
For tubes positive for the production of yellow color (for the case of total coliforms) or yellow color and blue fluorescence (in the case of E. coli) the confirmatory element was observed.
Confirmatory Phase: for total coliforms, in some countries, the definition of total coliforms by the applicable standard involves producing gas from lactose. The MPN method with the use of CCL provides no gas formation from lactose contained in the medium; however, we decided to include this indicator during the study in order to compare its inclusion in those cases in which regulations require do require it. Thus, in this way the total coliforms can be confirmed by the increase in turbidity of the medium and its yellow color as well as by the production of gas. The response is considered positive in one variable if there is production of gas. For E. coli, the cultures determined to be positive and with blue fluorescence we proceeded with the indole reaction (positive for this microorganism). For this assay, 3 mL of culture were taken with a sterilized pipette and transferred to a sterilized assay tube, adding 0.2-0.3 mL of Kovac's reagent. A response was considered positive for E. coli if growth was detected, accompanied by the appearance of a yellow color (positive β-D-galactosidase reaction), blue fluorescence at 366 nm (positive β-D-glucoronidase reaction), and a red color ring in the indole test.
Confirmation of the samples as part of the comparison of methods (Phase of complementary comparison): as known, even standardized methods can generate false positives or false negatives. As part of the comparison protocol (not as part of the methods per se), an additional stage was designed only for E. coli within the framework of this protocol. Plates of AE were inoculated from the CCL positive tubes for E. coli to be incubated at 35 ± 2ºC for 18-24 h. Inoculation of AE plates with the isolated colonies took place in the following manner: in aseptic conditions, an inoculation loop of 3 mm in diameter was introduced in the CCL-positive, tilting it and sinking the loop to 0.5 cm, the first quadrant of the AE was seeded, the loop was sterilized (flamed) again and the application continued. Up to 5 colonies were selected per plate, coding them as typical or atypical: typical (bright metallic green upon reflection of light with a dark center in the transmitted light) and atypical: having different characteristics. They were simultaneously inoculated in NA and in Iron Kliger agar medium (AHK) to preserve for future identification. When necessary, the colonies were kept in the CTA. If 1 of the 5 colonies was identified as E. coli or coliform, this was considered as sufficient identification, discarding the rest of the colonies. Of a total of 1610 colonies from the CCL test, 773 (48%) were identified. Phase Identification: all colonies were inoculated into culture media for biochemical tests from CTA. NA-plates were incubated for 18 to 24 h at 35 ± 2°C for Gram staining and cytochrome oxidase test. From the CTA-supplemented medium, we proceeded to inoculate the following media with the aim of identifying the germ: all Gram negative cultures underwent IMViC tests in the culture media, Tryptone Water (TW), Medium MR-VP (MR-VP) Simmons Citrate Agar (CS) and checking gas production in CLT with Durham tubes. Where necessary, identification was strengthened in an additional step, especially to identify non-target microorganism colonies, with additional biochemical tests, similar to those used for the reference method.
Calculations and statistical analysis
For comparative analysis, MPN values were taken before and after confirmation with the indicated biochemical tests of the isolated colonies in both methods and the tubes were analyzed according to the Standard Methods [32] . For most comparative statistical analyses, logarithmic transformation was used according to Excel (Microsoft). The statistical analysis was performed with the help of SmartVal Program [36], based on the definitions described in EN ISO 16140 [30].
Determined Parameters
The index of the most probable number (MPN) per 100 mL was calculated for total coliforms, fecal coliforms, and E. coli by both methods according to the table described in Standard Methods [32]. In cases considered negative, the result was expressed as <1.8 and for statistical purposed it was considered equal to 1. Different recommended parameters were determined for the validation of alternative microbiological methods for water and food, contained mainly in ISO 16140 [30] and ISO/TR 13843 [37], in "Protocol for the validation of alternative microbiological methods" [38]: true positives (TP), true negative (TN), positive deviation (PD), negative deviation (ND), analysis of discordant results, relative sensitivity (RS), relative specificity (RSP), relative accuracy (RA), Kappa index (k), inclusivity, and exclusivity.
Relative Accuracy, Relative Specificity, and Relative Sensitivity
Paired data of the alternative method and the reference (Table 1) were tabulated and performance parameters were calculated from the tabulation (Table 2 x 2).
Table 1. Paired results of the reference method and the alternative method
| Responses | Positive by the reference method (R+) | Negative by the reference method (R-) |
|---|---|---|
| Positive by alternative method (A+) | ++ Concordance of positive (PC) | Positive deviation (PD) (R-/A+) |
| Negative by alternative method (A-) | +/- Negative deviation (ND)(A-/R+) | Negative concordance (NC) |
The calculation was made as follows:
Relative Accuracy (RA) = ((PC+NC)/N)x100%
Relative Specificity (RS) = (NC/N-)x100%
Relative Sensitivity (RS) = (PC/N+)x100%
Where:
N: total number of samples (NC + PC + PD + ND)
N-: total number of negative results by the reference method (NC + PD)
N+: total number of positive results by the reference method (PC + ND)
Confidence intervals
Calculating confidence intervals for the number of samples tested was calculated as set forth below:
For each percentage (p) of the RA, RS and RSP and if 10% < p <90%, the approximate confidence interval (CI) is taken for two tails at 95%, being CI (at 95%) = with n = N, N +, N-, respectively, for p (in %) = RA, RS, RSP, where p: percentage of the index study (p of RA, or RS, or RSP), n: number of samples studied for the index, for example or RA, take N, for RS, take N+ and RS, it takes N. For the case where p > 90%, we calculated the lower confidence limit of 95% (one-tailed), with n≈ N, N +, N-, respectively, for p (in%) = RA, RS, RSP. For the latter case is considered preferable to use the binomial table for n = 10, 20, 30, 40, 50, 60.
Discordant results
Discordant results were analyzed by the McNemar test, using the number of positive deviations (PD) and negative deviations (ND). First we calculated the number of discordant results (Y) as follows: Y = PD + ND and determined if both methods are different based on the balance Sensitivity vs. Specificity: for Y < 6, (less than 6 disagreements): there is no test available and we did not proceed the analysis; and for 6 ≤ Y ≤ 22 (6 to 22 disagreements), m was determined as the lowest value of PD and ND. If m ≤ M for a given Y, both methods are considered different at an α < 0.05 (2-tailed).
Interpretation of results
Given the number of positive and negative deviations, we assessed the ability of the alternative method to provide greater or lesser amount of true positive results compared to the reference method and performed a comparative assessment between the results obtained for naturally contaminated samples and those artificially contaminated.
Results and Discussion
Total Coliforms: Qualitative comparison of total coliforms/Relative Accuracy, Sensitivity and Specificity/Global analysis of the samples
A total of 97 samples were analyzed with different levels of contamination according to the ISO 16140 [30] methodology. Overall analysis results of the samples are presented in Table 2.
Table 2. Results of the global analysis of water samples for total coliforms
| Responses | Positive by the reference method (R+) | Negative by the reference method (R-) |
|---|---|---|
| Positive by alternative method (A+) | 72 | 1 |
| Negative by alternative method (A-) | 4 | 20 |
Resulting indicators with their respective confidence intervals were:
Relative Accuracy = 94.85 ± 0.90%
Relative Sensitivity = 94.74 ± 0.90%
Relative Specificity = 95.24 ± 0.80%
As shown, relative sensitivity is high compared with the reference method and the relative accuracy is high and greater than 90%.
The value for relative specificity was because with the alternative method the presence of coliforms was detected in 1 sample, whereas with the reference method this was negative. The confirmation with biochemical tests of colonies isolated according to CCL in the discrepant samples are shown below: in one of the samples analyzed with the reference method no total coliforms were detected, and with the new alternative method, colonies of Aeromonas were detected, resulting false positive. These findings are consistent with results obtained by other authors [39,40], who found interference with coliform counts in agar medium with chromogenic substrate with other ß-D-galactosidase-producing bacteria [41,42] such as species of Aeromonas and Vibrio. Moreover, for the 4 samples negative by the alternative method, the reference method yielded: the group Serratia liquefaciens and Enterobacter aerogenes in one of the samples; in another, Enterobacter sakazakii was identified, the other two samples revealed E. coli colonies. Likewise, we used a similar statistical analysis to determine the Kappa (k) index from chance (frequency) of occurrence that takes into account the discrepancies as and the concordances as a whole and demonstrates the strength of the alternative method with respect to the standard. As the resulting Kappa index (0.86) was greater than 0.8, it was concluded that the agreement between the two methods is almost perfect [38].
Discordant results analysis was not implemented for lack of any statistical test for such a small number discrepancies. We can say that in the indicators of the MPN method, using the CCL medium, is equivalent in terms of sensitivity, specificity, and accuracy in the analyzed samples.
Total coliforms: Quantitative indicators
An equivalence analysis based on the evaluation of the maximum allowable deviation (-D = 20%) of the alternative method (for one tail), relative to the reference method according to ISO 17994 [44] (Anonymous, 2004) was also explored. It was based on comparison of the MPN obtained with the alternative method with the MPN obtained with the reference method. Results with MPN values of <1.8 were excluded. As a first step the expanded uncertainty was calculated at 22.33.
 = 22,33
Lower limit
 = -13,04
Upper limit
 = -31,62
Relative Mean Difference = 9.29
Test of hypothesis: Methods did not differ because XL is greater than -20 and less than 0; and XH is greater than 0, according to ISO 17994 [44] (Anonymous, 2004).
Total coliforms: Regression analysis
Regression analysis was performed based on the results of individual data of the CCL-MPN/100 mL at 24 h of the confirmed values. Logarithmic transformation was also performed. The absence of growth (MPN <1.8, was transformed, taking the log of value 1 and a unit value was added to all the obtained values). Regression results are given in the following: regression coefficient was 1.0855, which implied to apply the calculation method for an orthogonal regression (ISO 16140) [30] (Anonymous, 2002). The regression equation resulted to be: y = 0.04 + 1.09x.
It was observed that the intercept is = -0.04, close to zero, and the slope was 1.09 close to 1. This indicated that the MPNs from the alternative method were slightly higher than those of the reference, suggesting a high degree of linearity. Variance analysis yielded an F value of 2.99, lower than the critical (3.05), so goodness of fit (linearity) was proven.
Escherichia coli
E. coli: Qualitative comparison/Relative Accuracy, Sensitivity and Relative Specificity/Global analysis
A total of 99 samples from all contamination levels were analyzed according to the methodology of ISO 16140 [30] (Anonymous, 2003). Overall analysis results of the samples are presented in Table 3.
Table 3. Results of the global analysis of water samples for E. coli
| Responses | Positive by the reference method (R+) | Negative by the reference method (R-) |
|---|---|---|
| Positive by alternative method (A+) | 48 | 0 |
| Negative by alternative method (A-) | 3 | 48 |
Resulting indicators with their respective confidence intervals were:
Relative Accuracy = 96.00 ± 0.94%
Relative Sensitivity = 92.18 ± 0.88%
Relative Specificity = 100.00 - 1.00%
As can be seen, the relative sensitivity is very high compared to the reference method, relative accuracy is higher than 90%. The relative specificity value was due to the absence of positive deviations. Confirmation with biochemical tests on colonies isolated through CCL in the discrepant samples are as follows: for the 3 negative samples through the alternative method, E. coli was identified through the reference method, but not by the alternative method. An analysis of discordant results was not performed because there is no minimum number (m) of discordant results. We can state that in terms of specificity that the MPN method, using the CCL medium exceeds the reference MPN, and is equivalent in terms of sensitivity and accuracy. Likewise, a similar statistical analysis was used to determine the Kappa (K) index from the expected chance (frequency) of occurrence and which took into account the discrepancies and concordances as a whole, and demonstrated the strength of the alternative method as compared to the standard. Kappa = 0.92 was greater than 0.8, implying that the agreement between both methods was almost perfect [38], which is the best criterion for the acceptance of an alternative method. It was concluded from this set of indicators that both methods are equivalent in determining the absence or presence of E. coli in different water samples with different contamination levels.
E. coli: Quantitative Indicators
Equivalence analysis was based on a single tail of the maximum acceptable deviation (-D = 20%) of the alternative method, with respect to the reference according to ISO 17994 [43] (Anonymous, 2004).
The analysis was based on comparing the MPN obtained by the alternative method with the MPN obtained by the reference method. Included were the results with MPN values<1.8, as MPN = 1.0, when both methods gave the same result. As a first step we calculated the expanded uncertainty U = 12.10, its Lower Limit  = -11,80 and Upper Limit
  = 12.41 for a Relative Mean Difference 0.31. The hypothesis test showed that the methods do not differ since XL was greater than -20% and less than 0; and XH was greater than 0.
E. coli: Regression analysis
Regression analysis was performed based on the analysis of individual data of the CCL MPN/100 mL at 24 h of the confirmed values. Logarithmic transformation was performed. The absence of growth (MPN <1.8, was transformed by taking the log of the value 1 and a unit was added to all other values).
The regression results are listed as follows:
The regression coefficient was = 1.53, the regression equation resulted to be
y = 0.02 + 0.99x.
It was observed that the intercept is 0.02 and the slope 0.99. This indicated that the values of the alternative MPN were slightly higher than the reference, suggesting a high degree of linearity. The analysis of variance showed a value of F (1.81) much smaller than the critical (3.05), so goodness of fit (linearity) was proven.
Summary of the obtained main indicator values
The following tables show the values obtained for the different parameters studied, the acceptance criteria, and the final evaluation of each.
Analysis of total coliforms
Tables 4 and 5 show respectively, the qualitative and quantitative performance indicators for total coliform bacteria in water samples.
Table 4. Summary of the main performance indicators of the new method of Presence/Absence for the determination of total coliforms in water samples.
Qualitative parameters (Presence/Absence)
| Evaluated Parameter | Result obtained | Acceptance Criteria |
|---|---|---|
| Relative Accuracy | 94.85 ± 0.90% | > 90% |
| Relative Sensitivity | 94.74 ± 0.90% | > 90% |
| Relative Specificity | 95.24 ± 0.80% | - |
| Kappa index | 0.86 | > 0.80 |
| Discrepancies | 5 in 97 | There is no statistical criterion |
Table 5. Summary of the main performance indicators of the new method of counting total coliforms in water samples.;
Quantitative Parameters (count)
| Parameter evaluated | Result obtained | Acceptance criteria |
|---|---|---|
| Hypothesis of equivalence based on limits and dispersion | XL = -13.04; XH = 31.62 |
-20 ≤ XL ≤ 0, XH > 0 |
| Regression | High correlation and linearity a ≈ 0, b ≈ 1 Fca; <Ftable |
a = 0, b = 1, Fca; <Ftable |
Fca: Stadigraph calculated F Fisher; Ftable: Stadigraph F of theoretical Fisher
Analysis of E. coli
In Tables 5 and 6 we show the qualitative and quantitative performance indicators for E. coli in water samples.
Table 6. Summary of the main performance indicators of the new method of Presence/Absence for the determination of E. coli in water samples.
Qualitative parameters (Presence/Absence)
| Evaluated Parameter | Result obtained | Acceptance Criteria |
|---|---|---|
| Relative Accuracy | 96.00 ± 0.94% | > 90% |
| Relative Sensitivity | 92.18 ± 0.88% | > 90% |
| Relative Specificity | 100,00 to 1.00% | - |
| Kappa Index | 0.92 | > 0.8 |
| Discrepancies | 3 en 99 | No statistical criterion |
Table 7. Summary of the main performance indicators of the new method of counting E. coli in water samples
Quantitative Parameters (Count)
| Parameter evaluated | Result obtained | Acceptance criteria |
|---|---|---|
| Hypothesis of equivalence based on limits and dispersion | XL = -11.80, XH = 12.41 |
-20 ≤ XL ≤ 0; XH > 0 |
| Regression | High correlation and linearity A ≈ 0, b ≈ 1 Fca; <Ftable |
a = 0, b = 1, Fca; <Ftable |
Fca: Statigraph calculated Fisher F; Ftable: Stadigraph F of theoretical Fisher
Detection of coliforms by conventional methods is based on the acid and gas production from lactose. But occasionally, fecal coliforms, particularly E. coli, lack the enzyme hydrogenase and do not produce gas. For these reasons, the current trend is to define coliforms by the existence of the enzyme ß-D-galactosidase and ß-D-glucuronidase in 94-96% of E. coli [44] .
Relative specificity for total coliforms and E. coli was 95.24 ± 0.80% and 99-100%, respectively. Other authors refer in their studies 93.1% and 95.7% of specificity for total coliforms and E.coli, respectively, in the culture medium with the chromophore indoxyl-ß-D-glucuronide and fluorophore 4-methylumbelliferil-ß-D-galactopyranoside, reporting 4.3% false-positive and false-negative [2].
Results according to NordVal
The scatter plot for total coliforms according to the NordVal protocol is presented in Figure 1.
Figure 1: Scatter graph around the regression equation for total coliforms
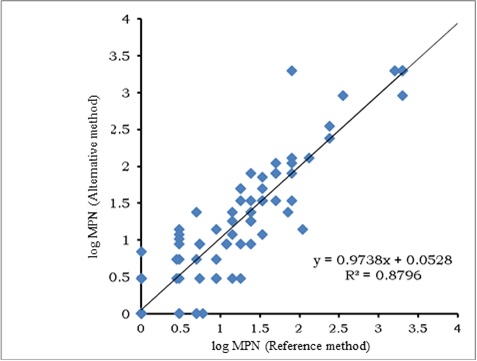
As can be seen and was expected, dispersion of data was higher at lower concentrations of total coliforms in the sample. Likewise, an aberrant result was observed between values of 1.5 and 2 log MPN, which, when analyzed its possible elimination did not change significantly the regression equation that describes the dependence between both methods. Despite the discrepancies in values, the resulting regression equation showed equivalence between the two counting methods, as the value of the intercept (0.052) did not differ significantly from 0 and the slope (0.973) was not significantly different from 1. The statistical analysis for testing the hypothesis of linearity showed that the calculated X was less than the critical and, therefore, linearity in the regression existed. Comparison of the average values by both methods is shown in Figure 2.
Figure 2: Distribution graph of means and standard deviations of the new method and the reference method for total coliforms.
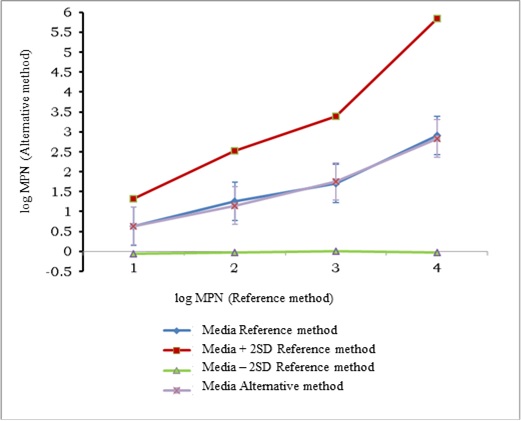
The mean by the alternative method was part of the range of the median for the reference method ± 2SD and the standard deviation of the alternative method was framed within the expanded uncertainty interval of the reference method, so it was considered that the two methods are equivalent for the quantification of total coliforms, by the multiple tubes technique, in water samples.
E. coli
The scatter graph for E. coli according to the NordVal protocol is presented in Figure 3.
Figure 3: Scatter graph around the regression equation for E. coli.
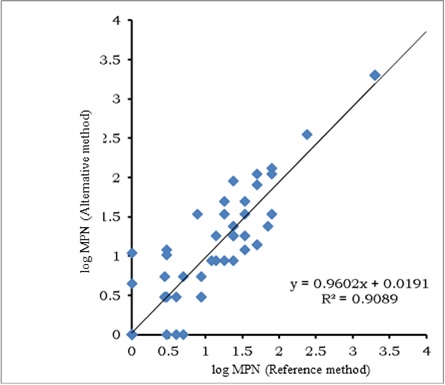
Just as for total coliforms, data scatter was larger at lower concentrations of E. coli in the sample. The resulting regression equation showed equivalence between the two counting methods, since the value of the intercept (0.019) was not significantly different from 0 and the slope (0.960) was not significantly different from 1. The statistical analysis for testing the hypothesis of linearity showed that the calculated X was less than the critical and, therefore, there was linearity in the regression. Comparison of the average values by both methods is shown in Figure 4.
Figure 4: Distribution graph distribution of means and standard deviations of the new method and of the reference method for E. coli.
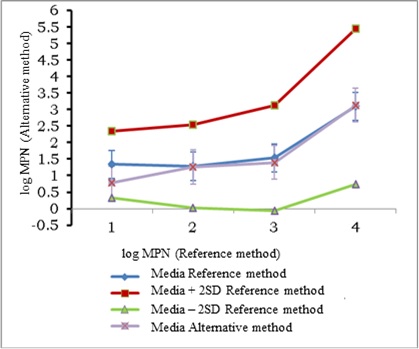
The mean by the alternative method was set within the range of the average for the reference method ±2SD and the standard deviation of the alternative method was also set within the expanded uncertainty interval of the reference method, so it was concluded that the two methods are equivalent for the quantification of E. coli by the multiple tubes technique in water samples.
Competing Interests
The authors have declared that no competing interests exist.
Acknowledgements
We are grateful to the research and technical staff from the Culture Media Research Department from BioCen. This work was supported by the Cuban Scientific Pole.
Author Contributions
ZQG carried out the molecular biological studies, participated in the sequence alignment and drafted the manuscript. BFY participated in the sequence alignment. ZQG participated in the design of the study and performed the statistical analysis. BFY conceived of the study, and participated in its design and coordination and helped to draft the manuscript. All authors read and approved the final manuscript.
Conclusions
By different validation methodologies of alternative methods it was proven that the new chromogenic fluorogenic method using the Most Probable Number, employing methylumbelliferil-ß-D-glucuronide and ortho-nitrophenyl-ß-D-galactopyranoside as enzymatic markers for the detection and counting of coliforms and E. coli, is equivalent to the procedures described in Standard Methods for the same purpose in terms of diagnostic accuracy and precision of the count The composition of the culture medium used allowed for the correct determination of the target microorganisms, in a slightly superior way than the reference method. The new procedure allowed obtaining results in less time, with less reagents, and more easily.
References
- Manafi M, Kneifel W (1989) A combined chromogenic-fluorogenic medium for the simultaneous detection of coliform groups and E. coli in water. Zentralbl Umweltmed Hyg 189: 225-234.
- Brenner KP, Rankin CC, Roybal YR, Stelma Jr GN, Scarpino PV, et al. (1993) New medium for the simultaneous detection of total coliforms and Escherichia coli in water. Appl Environ Microbiol 59: 3534-3544.
- Rompré A, Servais P, Baudart J, de-Roubin MR, Laurent P (2002) Review Detection and enumeration of coliforms in drinking water: current methods and emerging Approaches. J Microbiol Methods 49: 31-54.
- Niemela SI, Lee JV, Fricker CR (2003) A comparison of the International Standards Organisation reference method for the detection of coliforms and Escherichia coli in water with a defined substrate procedure. J Appl Microbiol 95: 1285-1292.
- Eccles JP, Searle R, Holt D, Dennis PJ (2004) A comparison of methods used to enumerate Escherichia coli in conventionally Treated sewage sludge. J Appl Microbiol 96: 375-383.
- Bernasconi C, Volponi G, Bonadonna L (2006) Comparison of three different media for the detection of E. coli and coliforms in water. Water Sci Technol 54: 141-145.
- Pitkänen T, Paakkari P, Miettinen IT, Heinonen-Tanski H, Paulin L, et al. (2007) Comparison of media for enumeration of coliform bacteria and Escherichia coli in non-Disinfected water. TJ Microbiol Methods 68: 522-529.
- Fricker CR, Bullock S, Murrin K, Niemela SI (2008) Use of the ISO 9308-1 procedure for the detection of E. coli in water utilizing two incubation temperatures and two confirmation Routines and comparison with defined substrate technology. J Water Health 6: 389-397.
- Fricker CR, DeSarno M, Warden PS, Eldred BJ (2008) False-negative beta-D-glucuronidase reactions in membrane lactose glucuronide agar medium used for the simultaneous detection of coliforms and Escherichia coli from water. Lett Appl Microbiol 47: 539-542.
- Maheux AF, Huppé V, Boissinot M, Picard FJ, Bissonnette L, et al. (2008) Analytical limits of four beta-glucuronidase and beta-galactosidase-based commercial culture methods used to detect Escherichia coli and Total coliforms. J Microbiol Methods 75: 506-514.
- McLain JE, Williams CF (2008) Seasonal variation in accurate identification of Escherichia coli Within a constructed wetland Receiving Municipal tertiary-treated effluent. Water Res 42: 4041-4048.
- Wohlsen TD (2011) Comparative evaluation of chromogenic agar CM1046 and mFC agar for detection of E. coli and thermotolerant coliform bacteria from water samples. Lett Appl Microbiol 53: 155-160.
- Herrera A, Suarez P (2005) Bacterial indicators as tools to measure the environmental quality of coastal water. INCI 30: 171-176.
- Fujioka R, Sian-Denton C, Borja M, Castro J, Morphew K (1999) Soil: the environmental source of Escherichia coli and enterococci in Guam's streams. Symp Suppl J Appl Microbiol 85: 83S-89S.
- Anonymous U.S. FDA/CFSAN. ONLINE (2002) Bacteriological Analytical Manual. Chapter 4 Enumeration of Escherichia coli and the Coliform Bacteria.
- Díaz Pérez M, Durán Vila A, Zhurbenko R, Rodríguez Iglesias I, Viera DR, et al. (2002) Utility chromogenic media and/or fluorogenic CromoCen CromoCen CC and SC in the analysis of wastewater. Latinoam Microbiol Rev 44:425. Supplement.
- Rodríguez Martínez C, Quesada VdeJ Muñiz, Zhurbenko R, inventors (2006) National Center of Biological, assignee. Culture medium and method for Identifying Gram-negative microorganisms patent U.S. 1,323,832.
- Quesada Muñiz VdeJ, Rodríguez Martínez C, inventors (2006) National Center of Biological, assignee. Composition and method for the early detection and count and differentiated Gram-negative detection of microscopic organisms. EP 1196625.
- Zhurbenko R, Rodriguez C, Mezquida I, Ortega A, Abreut Y (2007) Development of a liquid medium (CromoCen CCL) for the simultaneous detection and confirmation of Escherichia coli and other coliforms in water samples biotechnological industry. In: Valdes R, Torres D, Zumalacárregui L, Gonzalez M, Aragon M, et al. editors. Proceedings of the International Biotechnology Havana 2007, Havana, Cuba, Elves Scientiae, GP-62.
- Barroso de la Cruz ES, Rodríguez Martinez C, Zhurbenko R (2006) Effectiveness of the culture medium CromoCen®CC in the diagnosis of urinary tract infection. Integr Gen Rev Cubana Med 22. http://scielo.sld.cu/scielo.php?script=sci_ arttext & pid = S0864-21252006000400005
- Fuentes M, Valladares J, Grass G, Pico Y (2011) Microbiota de interés para la salud pública de Oreochromis spp. (tilapia roja) cultivada en jaulas flotantes en agua dulce. Rev Cub Inv Pesq 28: 74-80.
- Aguilera-Arreola MG, Portillo-Munoz MI, Rodriguez-Martinez C, Castro-Escarpulli G (2012) Usefulness of a CromoCen® Chromogenic agar medium for the identification of the genus Aeromonas: Assessment of fecal samples. J Microbiol Methods 90: 100-104.
- Anaya M, Barbará E, Padrón J, Borrego SF, Valdés O, et al. (2015) Influencia del campo magnetic sobre el crecimiento de microorganismos patógenos ambientales aislados en el Archivo Nacional de la República de Cuba. Biomédica 35: 325-336.
- del Río MN (2015) Empleo del medio cromogénico CromoCen SC para la identificación de Salmonella spp. en productos pesqueros. [Tesis]. La Habana, Universidad de La Habana.
- Anonymous Council Directive 98/83/EC (1998) On the quality of wáter intended for human consumption. http://eur-lex.europa.eu/LexUriServ/LexUriServ.do?uri=_ OJ:L:1998:330:0032:0054:EN:PDF
- Anonymous Standard Methods for the Examination of Dairy Products APHA (2004). http://ajph.aphapublications.org/doi/book/10.2105/9780875530024
- Anonymous Official Methods of Analysis of AOAC International, 20th Edition (2016). http://www.aoac.org/aoac_prod_imis/AOAC/Publications/Official_Methods_of_Analysis/AOAC_Member/Pubs/OMA/AOAC_Official_Methods_of_Analysis.aspx?hkey=5142c478-ab50-4856-8939-a7a491756f48
- nonymous. Bacteriological Analytical Manual (BAM). Food & Drug Administration of the USA (FDA) (2016). http://www.fda.gov/Food/FoodScienceResearch/LaboratoryMethods/ucm2006949.htm
- Anonymous ISO 9308-1 (2000) Quality water. Detection and enumeration of Escherichia coli and coliform bacteria Part 1: Method of membrane filtration. International Standards Organization, Geneva, Switzerland.
- Anonymous ISO 16140 (2003) Animal Microbiology of food and feeding stuffs-Protocol for the validation of alternative methods. International Standards Organization, Geneva, Switzerland.
- Anonymous ISO 6887-1 (1999) Animal Microbiology of food and feeding stuffs - Preparation of test samples, initial suspension and decimal Dilutions for microbiological examination - Part 1: General rules for the preparation of the initial suspension and decimal Dilutions. International Standards Organization, Geneva, Switzerland.
- Anonymous APHA, AWWA AEF (2005) Standard methods for the examination of water and wastewater. (21st ed.), American Public Health Association, Inc., Washington, USA.
- Rodríguez Martínez C, Zhurbenko R, Quesada VdeJ Muñiz, Lobaina Rodriguez T, Tsoraeva A, et al. (2004) Culture Media Guide. (Third Edition), BioCen, Havana, Cuba.
- Anonymous ISO 9308-3 (1998) Water quality - Detection and enumeration of Escherichia coli and coliform bacteria in surface and waste toilet. Part: Miniaturized method (Most Probable Number) by inoculation in liquid medium. International Standards Organization, Geneva, Switzerland.
- Stevens M, Ashbolt N, Cunliffe D (2003) Recommendations to Change the Use of Coliforms as Microbial Indicators of Drinking Water Quality. National Health and Medical Research Cpuncil. Australian Government.
- Rodríguez Martínez C, May Abad O (2010) SmartVal statistical package. BioCen, Cuba.
- Anonymous ISO / TR 13843 (2000) Water quality - Guidance on validation of microbiological methods. Technical Report. International Standards Organization, Geneva, Switzerland.
- Anonymous NordVal (2009) Protocol for the validation of alternative microbiological methods. NordVal/NMKL.
- Geissler K, Manafi M, Amoros I, Alonso JL (2000) Quantitative determination of total coliforms and Escherichia coli in marine waters with chromogenic and fluorogenic media. J Appl Microbiol 88: 280-285.
- González González MI, Torres Rojas T, Chiroles Rubalcaba S, Manafi M (2009) Media fluorogenic and chromogenic culture and consumer evaluation and coastal waters. Ambient Sanid Hig 9: 422-430.
- Davies CM, Apte SC, Peterson SM (1995) Possible interference of lactose-fermenting marine vibrios in coliforms β-D-galactosidase Assays. J Appl Bacteriol 78: 387-393.
- Alonso JL, Amoros I, Alonso MA (1996) Differential susceptibility of aeromonads and coliforms to cefsulodin. Appl Environ Microbiol 62: 1885-1888.
- Anonymous ISO 17994 (2004) Water quality-Between Criteria for Establishing equivalence microbiological methods. International Standards Organization, Geneva, Switzerland.
- Beauchamp CJ, Simao-Beaunoir AM, Beaulieu C, Chalifour FP (2006) Confirmation of E. coli Among other thermotolerant coliform bacteria in paper mill effluents, wood chips screening rejects and paper sludges. Water Res 40: 2452-2462.