Review Article
Authors:
Yinping Feng1, Liping Gu1, Liang Feng1, Weimei Li1, Fang Ma1*, Li Wei1* and Chaoyu Zhu1
1 Department of Endocrinology and Metabolism, Shanghai General Hospital, Shanghai Jiao Tong University School of Medicine, Shanghai, China
Corresponding author
Fang Ma, Department of Endocrinology and Metabolism, Shanghai General Hospital, Shanghai Jiao Tong University School of Medicine, Shanghai, China, E-mail: 12578981@qq.com
Li Wei, Department of Endocrinology and Metabolism, Shanghai General Hospital, Shanghai Jiao Tong University School of Medicine, Shanghai, China
Received Date: 04 July 2015; Accepted Date: 10 July 2015; Published Date: 14 July 2015
Citation
Feng Y, Gu L, Feng L, Li W, Ma F, et al. (2017) Contrast- Enhanced Ultrasound Quantitative Evaluation of Renal Tissue Perfusion in Early Diabetic Nephropathy. Enliven: Nephrol Renal Stud 4(1): 002.
Copyright
@ 2017 Dr. Fang Ma. This is an Open Access article published and distributed under the terms of the Creative Commons Attribution License, which permits unrestricted use, distribution and reproduction in any medium, provided the original author and source are credited.
Abstract
Purpose
Explore the characteristics and change rules of renal tissue perfusion in early diabetic nephropathy, and know about the application value of ultrasound imaging and quantitative analysis technique in evaluation of the renal tissue perfusion in early diabetic nephropathy.
Methods
34 glycometabolic disorder patients, who took part in the diabetics epidemiology investigation in East Campus of Shanghai No.6 People Hospital from Oct. 2015 to Jan. 2016, participated in this study. These patients include 10 sugar regulation damaged (IGR) patients, and 24 early diabetic nephropathy (DN,mAlb20-200mg/mmol) patients. Additionally, another 10 healthy people were recruited as Normal Controls (NC). The urine trace albumin (mAlb), urine albumin/uric creatinine (mAlb/Cr), serum creatinine (Scr), glycosylated hemoglobin (HbA1c), Blood Uric Acid (BUA), and Blood Urea Nitrogen (BUN) of all the participants were measured. The Glomerularfiltration Rate (GFR) were calculated with the MDRD.
Formula
GFR (ml/min1.73m2) =186×(Scr)-1.154×(Age)-0.203× (0.742 Female), and then compared. The participants were also subject to examination of CEUS perfusion imaging. The QLAB (Philips) was used to perform the quantitative analysis of renal perfusion, and measure the CEUS perfusion parameter values of the renal cortex and medulla, total Area under the Curve (AUC), Peak Intensity (DPI), the Curve Slope (A) and Time to Peak (TTP).
Results
Compared with the IGR group and NC group, the AUCs and DPIs of renal cortex and medulla of the DN group significantly increased (P<0.05). The AUC and DPI of renal cortex and medulla of the IGR group and NC group showed no significant difference.
Conclusion
CEUS technique can effectively analyze and evaluate the blood perfusion change in the early DN, but not when the sugar regulation is damaged.
Introduction
Diabetic Nephropathy (DN) is a very common but hard-to-treat syndrome of diabetes. It is one of the major causes of the End Stage Renal Disease (ESRD). The early-stage symptom of DN is mainly the rise of the reversible renal blood flow and blood capillary perfusion pressure related to hyperglycemia [1-3]. Many studies have demonstrated that the high perfusion and high filtration of kidney have significant influences on the early-stage kidney damage of diabetes [4]. The microvascular damage is main pathological basis of the diabetes damage, which is reversible in early stage but not in end stage. Thus, the early intervention is important for preventing the illness development. Contrast-enhanced Ultrasound has been widely used in kidney transplant [5], kidney neoplasms [6], renal cyst [7] and other clinical treatments due to its safety and simplicity. LiuB [8], used the target SonoVue-TM contrast agent to reflect the change of GK Rat Kidney Blood hemoperfusion in early stage. Wang L [9] applied the ultrasound contrast to explore the relationship between UA and kidney capillary perfusion of DKD patients. This paper applies the contrast-enhanced ultrasound to comparatively analyze the kidney CEUS blood perfusion characteristics and changing rules of early stage DN patients, abnormal glucose metabolism patients, and healthy people, and explores the feasibility of using the contrast-enhanced ultrasound quantitative analysis technique to evaluate the kidney blood perfusion of early stage DN patients. It will provide a new approach for diagnosing the DN in early stage.
Materials and Methods
Experiment Design
This study was approved by the Ethics Committee of Shanghai Sixth People Hospital East Campus. This study randomly selected 58 subjects from the Shanghai Sixth People Hospital East Campus from Oct. 2015 to Jan. 2016. None of them have renal cyst, kidney neoplasms, kidney stones, urinary infection, kidney paramorphia, kidney disease history, or other chronic disease history. The urine trace albumin (mAlb), urine trace albumin/uric creatinine (mAlb/Cr), serum creatinine (Scr), glycosylated hemoglobin (HbA1c), blood uric acid (BUA), and blood urea nitrogen (BUN) of all the participants were measured. The GFRs were calculated with the MDRD formula: GFR(ml/min1.73m2) = 186 × (Scr) - 1.154 × (Age) - 0.203 × (0.742*Female). All study are grouped by the China Type II Diabetes Prevention Guideline (2013), including 10 Sugar Regulation Damaged (IGR) patients, and 24 early diabetic nephropathy (DN, mAlb20-200mg/mmol) patients. Additionally, another 10 healthy people were recruited as Normal Controls (NC). The participants were also subject to examination of CEUS perfusion imaging. The QLAB (Philips) was used to perform the quantitative analysis of renal perfusion, and measure the CEUS perfusion parameters of the renal cortex and medulla, including total Area under the Curve (AUC), Peak Intensity (DPI), The Curve Slope (A) and Time to Peak (TTP).
Apparatus and Methods
CEUS
The Philips IU Elit of color doppler echocardiography was used for image analysis, and the probe frequency was 3.5-MHz. Both kidneys were scanned routinely. The double contrast imaging was started when the largest longitudinal section of kidneys was displayed. 5ml 0.9% NaCl physiological saline was injected to 25mg SonoVue freeze-dried powder. After being fully shocked, 1.2ml contrast agent was extracted and injected into the antecubital vein, followed by the flush of 5ml 0.9% NaCl solution. Subjects were instructed to breathe smoothly, and then the echo dynamic changes of their kidneys were continuously captured for 5 minutes.
As is shown in Table 2 and Table 3, there were no significant differences between the IGR group and the NC group in AUC and DPIs. Compared with the NC group and IGR group, the AUC and DPIs of the kidney cortex and medulla nephrica significantly increased in the DN group.
|
Groups |
n |
AUC |
DPI |
A |
TTP |
|
NC |
10 |
847.31 ± 186.32 |
12.63 ± 2.71 |
1.60 ± 0.76 |
25.02 ± 6.62 |
Table 2: Quantitative perfusion parameters of renal cortex
|
Groups |
n |
AUC |
DPI |
A |
TTP |
|
NC |
10 |
735.36 ± 369.27 |
10.90 ± 3.13 |
1.33 ± 0.66 |
27.18 ± 11.64 |
Table 3: Quantitative perfusion parameters of renal medulla
Date are presented as mean ± SD. *P < 0.05 vs. the corresponding control group; P < 0.05 vs. the IGR group. AUC, area under the curve; A, the curve slope; DPI, peak intensity; TTP,time to peak.
Quantitative Analysis
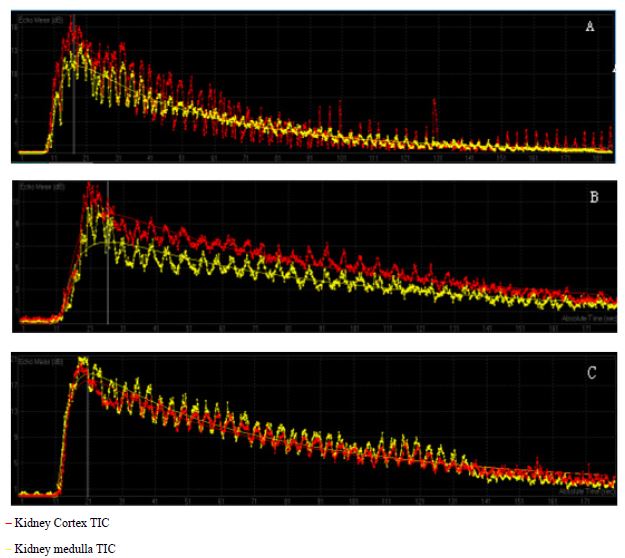
Set the kidney cortex and medulla with uniform development as the regions of interest (ROIs). ROIs are set with the free shape. Perfusion parameters of contrast-enhanced ultrasound in renal tissue were measured by the QLAB (Philips) software. The TIC perfusion curves were generated, and the software automatically derived the analysis parameters, including the total Area under the Curve (AUC), Peak Intensity (DPI), The Curve Slope (A), Time to Peak (TTP). For each case, the ROIs of the kidney cortex and medulla were measured for 3 times, respectively, and the averages were taken as parameter values (Figure 1 and Figure 2).
Figure 1:The CEUS of renal tissue perfusion process of three groups. A:NC group; B:IGR group; C:DN group.
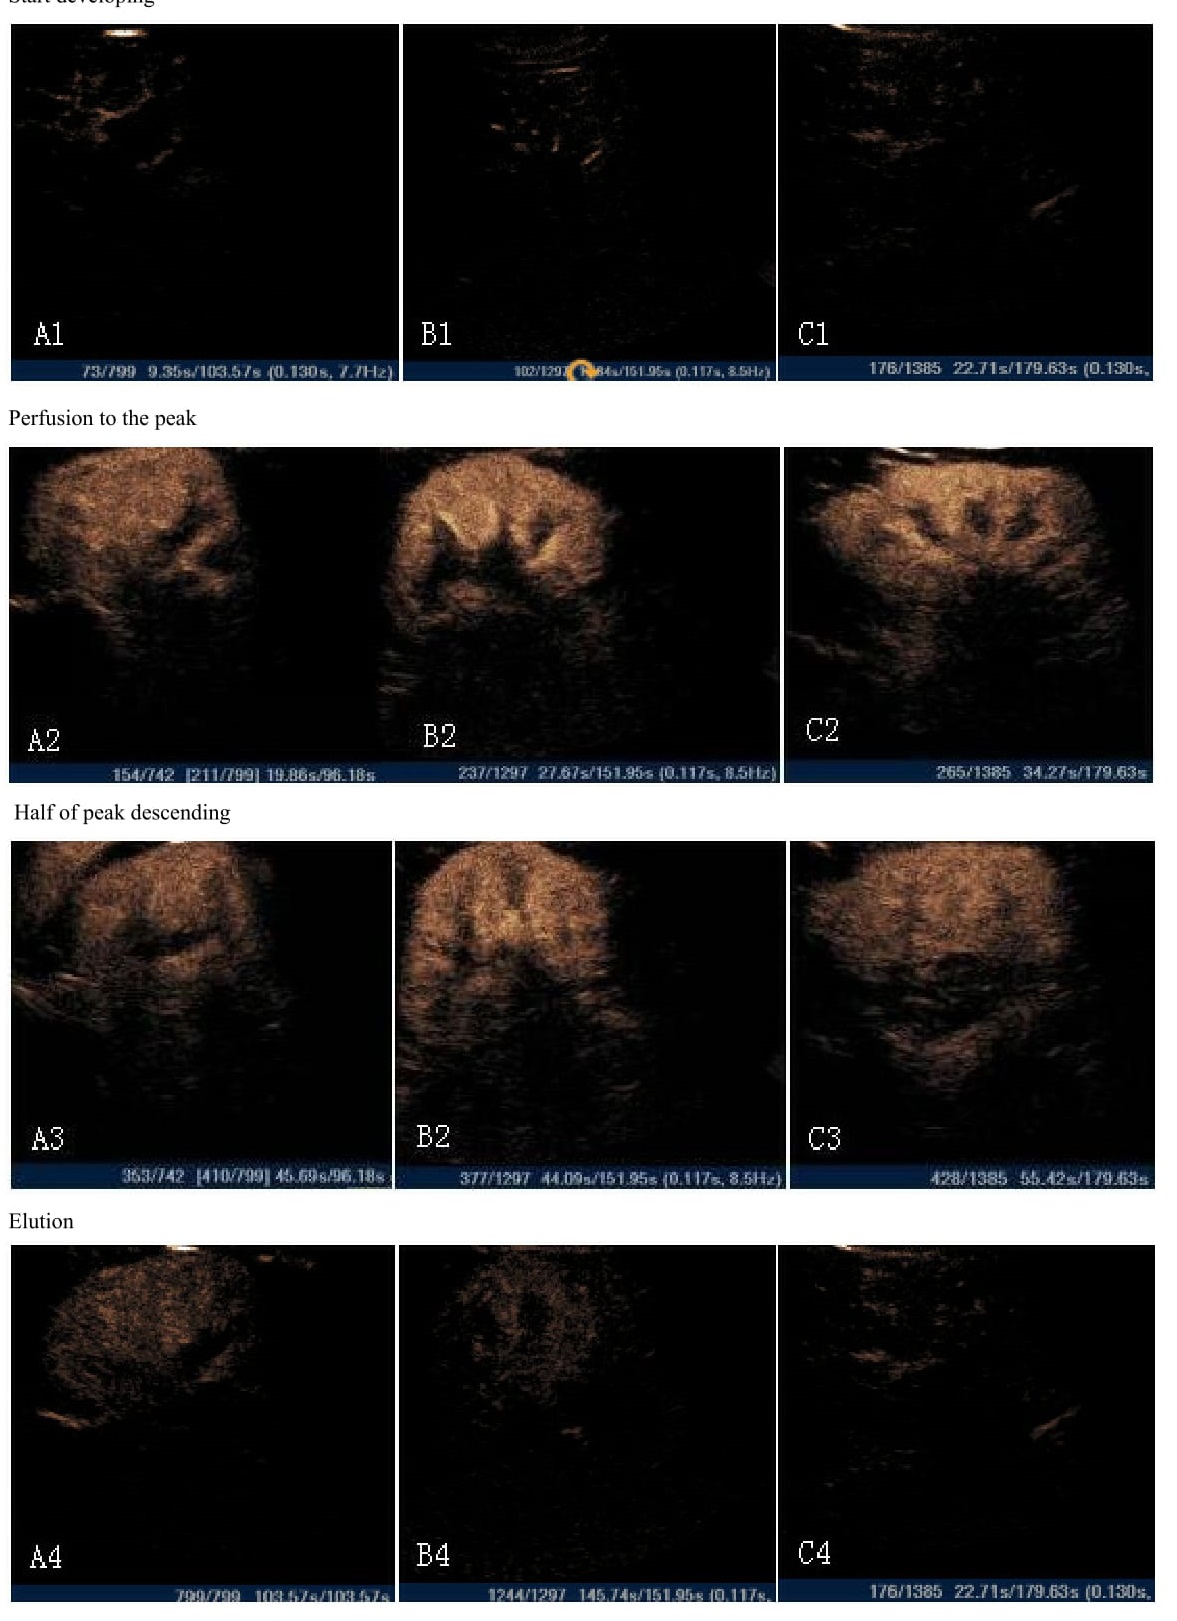
Figure 2:The fitting curves of renal tissue in NC group; B: The fitting curves of renal tissue in IGR group. A: The fitting curves of renal tissue in DN group. The CEUS TIC curves of renal cortex and medulla were all the asymmetric monopeak curves with ascending branch, summit and descending branch in three groups: the ascending branch was steep, and the descending branch was flat. A: The peek value of the kidney cortex was slightly higher than the medulla nephrica in NC group; B: The peek value of kidney cortex was slightly higher than the medulla nephrica in IGR sgroup; C: The peek value of kidney cortex was slightly lower than the medulla nephrica in DN group.
Statistical Analysis
All the data were expressed as mean ± Standard Deviation (SD). The one-way ANOVA and Kruskal-Wallis-test were applied for comparison of the basic parameters, renal cortex and medulla perfusion parameters of all the groups. The data analysis was performed using SPSS 19.0.
Results
General Parameters Comparison
The mAlb(P=0.00), HbA1c(P=0.00), UA(P=0.03) of the DN group and IGR group were significantly higher than control group. The mAlb/Cr (P=0.01), Scr (P=0.66), GFR (P=0.61), BUN (P=0.64) showed no significant differences in the three groups (Table 1).
| Variable | NC(20n) | IGR(10n) | DN(24n) | F | P |
| mA1b mA1b/Cr Scr HbA1c GFR BUA BUN |
10.01 ± 6.67 9.2 ± 6.23 67.76 ± 15.96 5.69 ± 0.25 98.18 ± 34.17 319.12 ± 78.89 5.94 ± 4.21 |
101.82 ± 144.59 89.92 ± 143.58 63.36 ± 16.07 7.6 ± 1.74 76.14 ± 30.33 318.0 ± 60.59 6.37 ± 4.33 |
13.52 ± 10.15 10.83 ± 6.51 63.94 ± 14.62 6.91 ± 1.41 81.87 ± 30.65 274.29 ± 54.51 6.79 ± 4.30 |
9.46 7.63 0.42 8.46 0.50 3.60 7.54 |
0.00 0.10 0.66 0.00 0.61 0.03 0.64 |
Real-time observation of the kidney tissue perfusion
As is shown in table 2 and table 3, there were no significant differences between the IGR group and the NC group in AUC and DPIs. Compared with the NC group and IGR group, the AUC and DPIs of the kidney cortex and medulla nephrica significantly increased in the DN group.
After injection of contrast through the elbow vein, renal artery, segmental artery, leaf artery, cortex, medulla, and sinus were reinforced in sequence until they reached the peak values. The renal artery, and segmental artery were reinforced rapidly to be ?dendritic", the renal cortex was reinforced uniformly, and the renal medulla and lsinus were reinforced relatively slowly. After reaching the peak, the development strengths of enhanced contrasts then decreased gradually. After the injection of contrast agents, the echo intensities of kidney cortex were slightly higher than the medulla nephrica in the NC and IGR groups, whereas the echo intensities of kidney cortex were slightly lower than the medulla nephrica in the DN group. The renal sinus, medulla, and cortex were shown in the contrast agent washout in order.
Quantitative Analysis of Renal Perfusion in All Groups
Discussion
DN is a serious syndrome of diabetes. It is occult in onset and develops very slowly. Its main characteristics is the ingravescence of proteinuria. The kidney blood perfusion usually keeps in constant ranges in normal conditions. However, the occurrence of DN, no matter it is diffuse or limited, would change the blood perfusion somehow [8]. Thus, the early recognition and diagnosis to the DN microangiopathy (normal proteinuria, CKD1 or 2) would be critical for retreatment. It is infeasible to directly measure the vascular change in most conditions, but the contrast-enhanced ultrasound could trace the red blood cells with the ultrasound microbubbles to reflect the blood flow change, and then dynamically observe the organ or local vascular blood flow change. In addition, this technique has been used to evaluate various vascular areas and their microcirculations, such as carotid artery, carotid artery plaque, aorta abdominalis, and skeletal muscle perfusion [9-11]. As a mature, effective, safety and non-invasive microcirculation diagnosis fool, the contrast-enhanced ultrasound is valuable for studying the progress of DN, evaluating and defining the microcirculation change clinically.
Ma F et al. applied the contrast-enhanced ultrasound quantitative analysis technique to the 4, 12, and 20 weeks old GK rat, and found TTP, HDT, and AUC significantly increased at 5 percent significance level [12]. Additionally, for the 20 weeks old GK rat, the glomerulus densities were very low, and the distribution areas were very small, and (Not clear about the meaning). The thickness of GBM increased. Those rats also showed significant the glomerulosclerosis and interstitial blood vessel damage at 5 percent significance level. AUC had significantly negative relationship with the glomerulus blood vessel density at percent significance level. Liu B [8], used the target SonoVue-TM contrast agent to diagnose the early vessel endothelial injury and DN of GK rats. Compared with the control group, the DPI and AUC of renal cortex and medulla nephrica significantly increased at 5 percent significance level, which reflected the change of blood perfusion in the kidney of GK rats. They concluded that the contrast-enhanced ultrasound was effective in evaluating the kidney issue capillary perfusion and kidney hemodynamic characteristics of GK rats. In this study, compared with the IGR group and NC group, the AUC and DPI of the renal cortex and medulla nephrica significantly increased at 5 percent significance level. It indicated that the kidney blood perfusion of kidney obviously increased, which was consistent with the former studies. Compared with the NC group, the AUC and DPI of renal cortex and medulla nephrica of the IGR group do not show statistically significant difference.
It indicates that the CEUS cannot effectively evaluate the change of kidney cortexblood perfusion. Bahar A found that there was no significant difference for the microalbuminuriaprevalence rates of early-stage diabeticcs and IGT patients (17.8% vs 13.3%, P=0.4) [16]. They concluded that the microalbuminuria was high-risk for the prediabetes. It meant that the kidneys of patients did not have significant damage and the kidney blood perfusion did not have obvious change either in the IGR period. However, Bhatt Ap et al. found that for the diabetic complication cases with the damaged glucose tolerance, the IGT patients with regular glycosylated hemoglobinbin [17]. This case study further showed that IGT was a new source of the nodositas glomerulus sclerosis.
Ma F applied the real-time gray scale CEUS to evaluate the renal damage microvascular perfusion of diabetes of group A (CKDI-CKDII) and group B (CKDIV-CKDV). The result showed that compared with the control group, the rising slopes of the two groups were smoother, and their AT and TTP significantly increased [14]. However, A1 and PI in the two groups significantly decreased at 5 percent significance level. The AUC of group A tended to increase. In group B, the AUC1, AUC2, and AUC significantly decreased at 5 percent significance level. The AUC was positively related to the glomerulus GFR (r=0.472, P=0.472), but TTP did not show significant relationship with the glomerulus GFR (r=0.262, P=0.262). It concludes that PI, TTP, and AUC can be used to diagnose the kidney microvascular damage in early stage and end stage of diabetics. The CEUS could accurately evaluated the kidney microvascular perfusion in real-time and dynamically. It is safety, non-invasive and effective in diagnosing the microvascular perfusion damage severity of kidney.
Conclusions, the CEUS cannot effectively evaluate the change of blood perfusion of kidney cortex when the glycoregulation is damaged. However, it could evaluate the change of blood perfusion of DN in early stage.
Limitations: (1) The study does not make the renal pathology biopsy to patients, and lacks of the further study to the vasculopathy of DN, and its relationship with DPI and AUC; (2) The sample size is small. More samples are needed to determine the feasibility of using the ultrasound contrast agent to quantitatively evaluate the characteristics of blood perfusion of kidney cortex in early-stage diabetes and reflect the change of blood perfusion of DN in early stage.
Acknowledgement
This work was supported by the Shanghai Municipal Commission of Health and Family Planning (No.20134023), Shanghai, China, and The key discipline group program in health of Pudong New Distribution, Shanghai (PWZxq2014-07).
References
- Wegner M, Pioru?ska-Stolzmann M, Jagodzi?ski PP (2015) The impact of chromatin modification on the development of chronic complications in patients with diabetes. Postepy Hig Med Dosw (Online) 19: 964-968.
- Futrakul N, Futrakul P (2012) Renal microvascular disease predicts renal function in diabetes. Ren Fail 34: 126-129.
- Liu H, Xu H, Shen C, Wu C (2012) Effect of the best compatibility of components in Corni Fructus on WT1 expression in glomerular podocytes of type 2 diabetic rats with early nephropathy. Am J Chin Med 40: 537-549.
- Lee JH, Kim SS, Kim IJ, Song SH, Kim YK, et al. (2012) Clinical implication of plasma and urine YKL-40, as a proinflammatory biomarker, on early stage of nephropathy in type 2 diabetic patients. J Diabetes Complications 26: 308-312.
- Grabner A, Kentrup D, Pawelski H, Mühlmeister M, Biermann C, et al. (2016) Renal contrast-enhanced sonography findings in a model of acute cellular allograft rejection. Am J Transplant 16: 1612-1619.
- Lu Q, Huang BJ, Xue LY, Fan PL, Wang WP (2015) Differentiation of renal tumor histotypes: Usefulness of quantitative analysis of contrast-enhanced ultrasound. AJR Am J Roentgenol 205: W335-W342.
- Chang EH, Chong WK, Kasoji SK, Dayton PA, Rathmell WK (2016) Management of indeterminate cystic kidney lesions: Review of contrast-enhanced ultrasound as a diagnostic tool. Urology 87: 1-10.
- Liu B, Liang F, Gu LP, Wang CQ, Li XH, et al. (2015) Renal blood perfusion in GK rats using targeted contrast enhanced ultrasonography. Asian Pac J Trop Med 8: 668-673.
- Wang L, Cheng JF, Sun LP, Song YX, Guo LH, et al. (2015) Use of contrast-enhanced ultrasound to study relationship between serum uric acid and renal microvascular perfusion in diabetic kidney disease. Biomed Res Int 2015: 732317.
- Chinese Diabetes Society (2014) China Type II Diabetes Prevention Guideline. Chin J Diabetes 8: 1-42.
- Moriya T, Matsubara M, Kishihara E, Yoshida Y, Ouchi M (2016) Type 2 diabetic patients with diabetic retinopathy and concomitant microalbuminuria showed typical diabetic glomerulosclerosis and progressive renal dysfunction. J Diabetes Complications 30: 1111-1116.
- Staub D, Partovi S, Imfeld S, Uthoff H, Baldi T, et al. (2013) Novel applications of contrast-enhanced ultrasound imaging in vascular medicine. Vasa 42: 17-31.
- Scholbach TM, Vogel C, Bergner N (2014) Color doppler sonographic dynamic tissue perfusion measurement demonstrates significantly reduced cortical perfusion in children with diabetes mellitus type 1 without microalbuminuria and apparently healthy kidneys. Ultraschall Med 35: 445-450.
- Futrakul N, Futrakul P (2012) Renal microvascular disease predicts renal function in diabetes. Ren Fail 34: 126-129.
- Ma F, Yadav GP, Cang YQ, Dang YY, Wang CQ, et al. (2013) Contrast-enhanced ultrasonography is a valid technique for the assessment of renal microvascular perfusion dysfunction in diabetic Goto-Kakizaki rats. Nephrology (Carlton) 18: 750-760.
- Bahar A, Makhlough A, Yousefi A, Kashi Z, Abediankenari S (2013) Correlation between prediabetes conditions and microalbuminuria. Nephrourol Mon 5: 741-744.
- Bhatt AP, Gupta A, Vibha D, Sharma A, Mahajan S (2013) Florid diabetic complications in impaired glucose tolerance. Saudi J Kidney Dis Transpl 24: 86-88.
- Ma F, Cang Y, Zhao B, Liu Y, Wang C, et al. (2012) Contrast-enhanced ultrasound with SonoVue could accurately assess the renal microvascular perfusion in diabetic kidney damage. Nephrol Dial Transplant 27: 2891-2898.