Research Article
Rahul Bhargava1 and Prachi Kumar2
1Director, Laser Eye Clinic, Noida, India
2Associate Professor, Department of Pathology, Santosh medical College and Hospital, Ghaziabad, India
Corresponding author
Prof. Rahul Bhargava, Director, Laser Eye Clinic B2/004, Ananda Apartments, Sector-48, Noida 201301, India, Tel: +919999055223; E-mail: brahul_2371@yahoo.co.in
Received Date: 07th January 2015
Accepted Date: 19th February 2015
Published Date: 23rd February 2015
Citation
Bhargava R, Kumar P (2015) Can Conjunctival Impression Cytology be the First Line Diagnostic Test for Evaluation of Dry Eye Syndrome? Enliven: Clin Ophthalmol Res 1(1): 004.
Copyright
@ 2015 Prof. Rahul Bhargava. This is an Open Access article published and distributed under the terms of the Creative Commons Attribution License, which permits unrestricted use, distribution and reproduction in any medium, provided the original author and source are credited.
Abstract
Purpose: To determine how Conjunctival Impression Cytology (CIC), Schirmer test, Tear Film Break up Time (TBUT) and Rose Bengal Stain (RBS) correlate with dry eye symptoms. To calculate the sensitivity, specificity and likelihood ratio (LR) of these tests for diagnosis of dry eye.
Methods: A case control study was done at two referral eye centers in northern part of the Indian subcontinent. Symptomatic patients with dry eye were recruited based on their response to a questionnaire of dry eye related symptoms (Table 1). Age and sex matched healthy subjects served as controls. Sensitivity and specificity, as estimated by the area under receiver operating characteristic (ROC) curve were primary outcome measures and the correlation between dry eye symptoms (DESS) and ocular surface tests, were secondary outcome measures.
Results: Eyes of 320 symptomatic patients were compared to 350 eyes of age and sex matched healthy controls. The mean symptom score in cases and controls was 8±2.6 and 1.2±2, respectively (P<0.001). The diagnostic accuracy of these tests was CIC (AUC=0.957) >TBUT (AUC=0.793)>Schirmer (AUC= 0.765)>RBS (AUC=0.723). There was a stronger correlation between symptoms, CIC (Pearson’s coefficient, Adjusted R2=0.774) and TBUT (R2=0.580). However, the correlation of RBS (R2=0.361) and Schirmer (R2=0.475) with dry eye symptoms although positive, was less significant (R2<0.5).
Conclusions: CIC correlates best with dry eye symptoms and has excellent specificity and sensitivity in diagnosing dry eye as compared to other tests evaluated in the study.
Keywords
Dry eye; Conjunctival impression cytology; Sensitivity; Specificity; Receiver operating characteristic curve
Introduction
Dry eye syndrome (DES) is a multifactorial disease, affecting tears and the ocular surface. It is accompanied by increased osmolarity of tear film, and inflammation of the ocular surface [1]. Dryness of eyes and the accompanying ocular surface inflammation may alter epithelial cell morphology and goblet cell density; result in expression of pro-inflammatory cytokines, human beta-defensins (hBD) and surface markers like HLA-DR [2-3].
DES is a common public health problem and may significantly impact vision related quality of life; it is now a frequent reason that patient present to eye care clinics [4]. However, dry eye diagnosis and its management has been a challenging task for clinicians as most diagnostic tests for dry eye are poorly standardized, making compare between studies tenuous at best; a generally agreed upon ?gold standard? still does not exist [5]. Moreover, there is a lack of consistency amongst routine diagnostic tests; a severely symptomatic patient may have a normal Schirmer?s test and tear film break up time (TBUT), despite the fact that early cytological changes may be present in the conjunctiva and cornea on CIC [6].
Additionally, ocular signs and symptoms may be discordant; for instance, ocular symptoms might not occur despite reduction of tear production and not all symptomatic patients have abnormal tear function tests [7].
The aim of the present study was to compare the diagnostic accuracy of CIC and routine tear function tests like Schirmer, TBUT, and Rose Bengal Staining (RBS) for evaluating dry eye disease and to measure the extent to which these tests correlate with dry eye symptoms.
Methods
Patients
A case control study was done at Laser Eye Clinic Noida and Santosh Medical College, Ghaziabad, India, from Dec 2013 to August 2014. The trial was approved by the institutional review boards and the local ethics committee. A written informed consent for the study, based on Helsinki protocol was obtained from all the participating patients.
Inclusion Criteria
Consecutive patients with dry eye symptoms visiting day care clinic were invited to take part the study. Subjects were recruited based on their response to (Dry Eye Scoring System, DESS©), a questionnaire of dry eye related symptoms (Table 1). Age and sex matched healthy subjects served as controls.
| Symptom | Score (Maximum 18) | ||||
| Absent (0) | Sometimes (1) | Frequent (2) | Always (3) | Present | |
| Itching or burning | |||||
| Sandy or gritty sensation | |||||
| Redness | |||||
| Blurring of Vision | |||||
| Ocular fatigue | |||||
| Excessive blinking | |||||
Table 1. Dry eye questionnaire and scoring system (DESS©)
Scores of 0 to 6 were mild, 6.1 to 12 were moderate, and 12.1 to 18 indicated severely symptomatic dry eye [7,8]. ©Bhargava R. Laser Eye Clinic, Noida, India.
Exclusion Criteria
Patients using punctal plugs, topical medications like corticosteroids (six weeks prior to enrolment), anti-glaucoma drugs and oral anti-coagulants were excluded. Pregnant/lactating mothers, post-menopausal women, patients with ocular infection, past history of LASIK (laser in situ keratomileusis), cognitive and psychiatric disorders, lacrimal gland malignancy and allergy to fluorescein were also excluded.
Power Calculation
Power was calculated using DESS to detect clinical significance between cases and controls after data analysis., based on data from previously published study [5].Taking a lead from this study, power was calculated using DESS and assumptions were as follows: Odds ratio=9.2, exposed controls 23%, one sided alpha risk=5%, controls case ratio=1.09, total exposed =46.3086%, estimated power= 99.9999%.
Outcome Measures
Sensitivity and specificity, as estimated by the area under receiver operating characteristic (ROC) curve were primary outcome measures and the correlation between dry eye symptoms (DESS), tear film tests and CIC were secondary outcome measures.
Ophthalmic Examination and Measurements
The dry eye scoring system (DESS ©) was administered to all participants (cases and controls) prior to ophthalmic examination and tests. A score was assigned to common symptoms of dry eye (Table 1). DESS is assessed on a scale of 0-18, with higher scores representing dry eye severity. A symptom score of 0-6 represents mild, 6.1-12 moderate, and 12.1 to 18, severe dry eye [8-9].
The participants were instructed to visit the dry eye clinic in morning and all tests were performed at the same time of the day (between 10 am and 12 pm) in a dimly lit room. One eye was selected at random for evaluation. Patients were instructed not to use artificial tear preparations, 2 hours prior to testing. At first, the subjects underwent a detailed ocular examination by an independent investigator (not a study surgeon, KS). This included recording of corrected distance visual acuity (CDVA), slit lamp examination, assessment of lid margins, eye lashes, and meibomian gland orifice for any blockage or occlusion.
At each examination, subjects underwent tests of tear film characteristics such as Schirmer, TBUT, and RBS. The independent investigator (KS) was masked to the information obtained from the questionnaire.
TBUT was first performed as manipulation of eyelids may adversely influence the results. A sterile fluorescein strip containing 1 mg fluorescein sodium (Madhu Instruments, Delhi, India) was applied over the inferior bulbar conjunctiva. The strip was moistened with normal saline solution prior to application. The patient was instructed to blink naturally, without squeezing, several times to distribute the fluorescein. The tear film was observed on slit lamp using cobalt blue filter. The interval between the last complete blink and the first appearance of a dry spot on cornea was recorded with a timer. Three readings were taken in succession and averaged [10].
The subject then waited for 30 minutes and Schirmer test with anaesthesia (0.4% oxibupracaine hydrochloride) was done with eyes closed. The subject waited for another 30 min and the Rose Bengal test was performed with the hanging drop method. A van Bijsterveld score of 4 or more was considered positive for dry eye [11].
A single examiner performed CIC and was masked to information obtained from the questionnaire and tear function tests. CIC was performed by transfer method after anaesthetizing the eye with one drop of 0.4% oxibupracaine hydrochloride [12]. The lacrimal lake at inner canthus was dried with a cotton tip applicator. A circular 0.22 micron filter paper measuring 13 mm in diameter (Sartorius, Gottingen, Germany) was grasped with a blunt tipped forceps and applied over the inferior bulbar conjunctiva. CIC samples were obtained from the non-exposed conjunctiva to eliminate the influence of environmental related factors on ocular surface in the exposed part. The paper strip was gently pressed with a glass rod held in the other hand. The filter paper was removed in a peeling fashion after 4-10 seconds and specimen transferred to the lab for fixation (ethyl alcohol, formaldehyde, and glacial acetic acid in 20:1:1volume ratio) and staining. Due to relative ease of handling, the filter paper was first placed on a glass slide with albumin paste to transfer the specimen to the slide, instead of working directly. However, loss of adhered material to the filter may be a potential disadvantage. The filter paper was then removed from the slide and the slide labelled and numbered. The slide was kept at room temperature and stained with periodic acid- Schiff and counterstained with hematoxylin and eosin. The mounted slide was first examined under the light microscope with 100x low power field (x 10 objective lens). After localization, cells were then analyzed with 400x final magnification (x 40 objective). At least 10 HPF (high power field) were examined for goblet cells and epithelial cells. The number of goblet cells per HPF were marked and counted. The mean goblet cell count per HPF and standard deviation (SD) was calculated. The coefficient of variation (COV) (%) = SD X 100/Mean. Estimated GCD (goblet cell density) =number of goblet cells counted per HPF divided by sampling area covered in mm2. Grading and scoring was carried out by criteria suggested by Nelson [13]. Nelson Grades 0 and 1 were regarded as normal, whereas grades 2 and 3 were considered to represent abnormal cytology.
Statistical Analysis
Statistical analysis was performed using SPSS software for windows (version 22, IBM Inc.). Means of groups were compared using t- tests. Chi-square tests were used for proportions. A P value <0.05 was considered statistically significant. Correlation analysis (along with regression) was done to study the relationship between dry eye symptoms, Schirmer, TBUT and CIC in cases and controls, respectively. Pearson?s correlation coefficient, R2>0.5 was significant. Sensitivity, specificity and Likelihood ratio was calculated taking Nelson grade as reference standard. The area under the receiver operating characteristic (ROC) curve was estimated using a logistic regression model.
Results
A total of 670 eyes were enrolled in the study. Eyes of 320 symptomatic patients were compared to 350 eyes of age and sex matched controls, after discarding 16 poorly stained CIC slides. The mean age among cases (22.8±2.6 years) was comparable to that of controls (23.8±7.1) (t test, P=0.126). There was no gender difference among cases and controls (P=0.214).
At baseline, 17(5.4%) cases were severely symptomatic, 196(61.2%) moderately symptomatic, 69(21.6%) mildly symptomatic and 38(12%) had occasional symptoms. Amongst controls, 9(2.6%) were moderately symptomatic, 74(21.1 %) mildly symptomatic and 267(76.3%) were symptom free. The mean symptom score in cases and controls was 8±2.6 and 1.2±2, respectively (P<0.001). Table 2 shows baseline characteristics of subjects among cases and controls.
| Parameter | Cases | Controls | T test (P value) |
| Age (years) | 22.8±2.6 | 23.8±7.1 | 0.126 |
| Symptom Score | 8±2.6 | 1.2±2 | <0.001 |
| Schirmer (mm) | 12±4.2 | 18.7±3.8 | <0.001 |
| TBUT (seconds) | 8.7±1.6 | 13.6±2.1 | <0.001 |
| RBS | 2.6±1.9 | 0.3±0.9 | <0.001 |
| Nelson Grade | 1.7±1.2 | 0.75±0.7 | <0.001 |
| GCD (cells/mm2) | 453±325 | 888±140 | <0.001 |
Table 2. Baseline Parameters of cases and controls.
TBUT (Tear Film Break up Time), RBS (Rose Bengal Stain), GCD (Goblet Cell density).
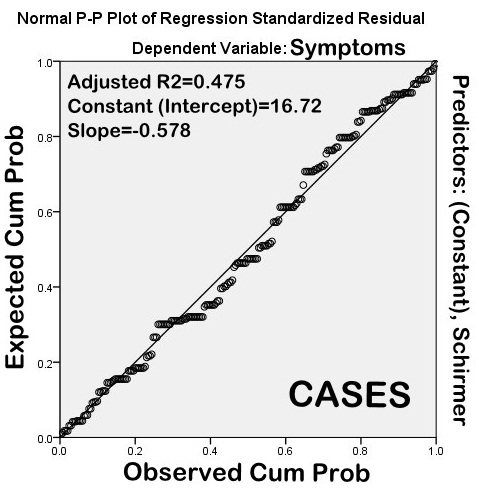
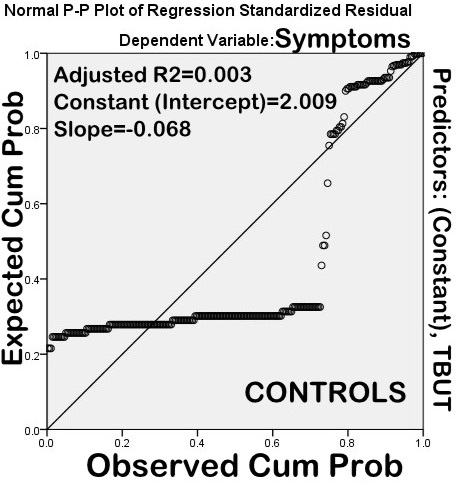
Impression cytology was normal (Nelson Grades 0 & 1) in 46.4% cases. Nelson grade 2 changes predominated (43%) amongst those having abnormal CIC (53.6%) On the contrary, 6.1% controls had abnormal cytology (Nelson grade 2). On correlation analysis (along with regression) (Table 3), there was a significant correlation between symptom severity and goblet cell density (Pearson?s correlation coefficient, R2=0.696). The correlation was not significant amongst controls (R2=0.007) (Figure 1). Likewise, TBUT also correlated well with symptom severity (R2=0.583) as compared to controls (R2=0.005) (Figure 2).
| Test | Cases | Controls |
| Schirmer | 0.475 | 0.016 |
| TBUT | 0.58 | 0.124 |
| RBS | 0.361 | 0.086 |
| Nelson Grade | 0.774 | 0.112 |
| GCD | 0.796 | 0.078 |
Table 3 Pearson?s Correlation coefficients for correlation between tests and dry eye symptoms.
TBUT (Tear Film Break up Time), RBS (Rose Bengal Stain), GCD (Goblet Cell density).
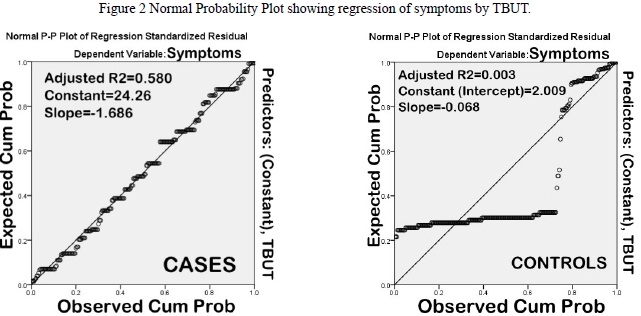
However, on correlation analysis along with regression, RBS and Schirmer did not correlate significantly with dry eye symptoms (Pearson?s correlation coefficient, R2=0.360 & 0.469, respectively) (Figures 3 and 4).
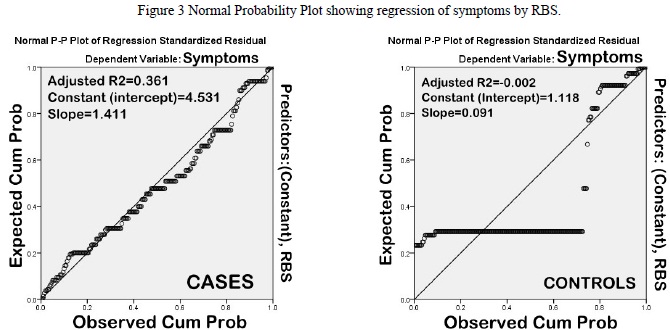
Figure 3 Normal Probability Plot showing regression of symptoms by RBS
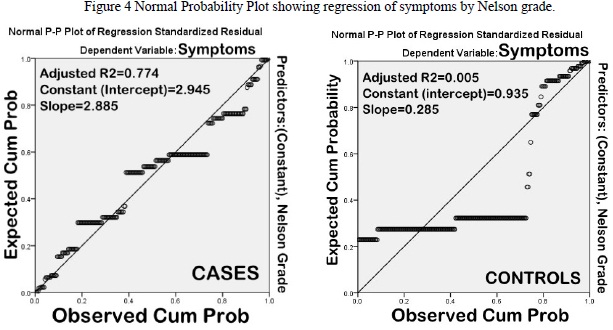
Figure 4 Normal Probability Plot showing regression of symptoms by Nelson grade.
The sensitivity of TBUT in diagnosing dry eye was 88.6% (95% CI-84.2 to 94.8%), specificity was 82.4 %( 95 % CI-75.5 to 86.4%), positive likelihood ratio was 4.36 (95% CI- 3.24 to 5.62), and negative likelihood ratio 0.14 (95% CI-0.08 to 0.20), respectively.
The sensitivity of Rose Bengal test in diagnosing dry eye was 34.6% (95% CI-30.6.4 to 40.6%), specificity 86% (95 % CI-80.4 to 92.6%), positive likelihood ratio was 2.02(95% CI- 1.34 to 2.86), and negative likelihood ratio 0.86 (95% CI- 0.74 to 0.94), respectively.
The sensitivity of Schirmer?s test in diagnosing dry eye was 38.2% (95%CI- 32.6 to 42.2%), specificity 82% (95% CI-76.8 to 86.3%), positive likelihood ratio was 2.12 (95%CI-1.46 to 2.82), and negative likelihood ratio 0.86 (95%CI-0.76 to 0.92), respectively.
On simple linear regression, 78% variability of GCD, 70% in Nelson grade, 58% in TBUT, 47% in Schirmer and 36% variability in RBS, respectively, could be explained by dry eye symptom severity. On analysis of variance, the probability corresponding to the F value< 0.0001, suggests that there was less than 0.01% risk in assuming that the null hypothesis (no effect of dry eye symptoms) was wrong.
The diagnostic accuracy of CIC, TBUT, Schirmer and RBS in dry eye patients was evaluated and compared with age and sex matched controls. The area under the curve (AUC) was measured using ROC curve (Figure 5). The diagnostic accuracy was CIC (AUC=0.957) >TBUT (AUC=0.793) >Schirmer (AUC= 0.765)>RBS (AUC=0.723).
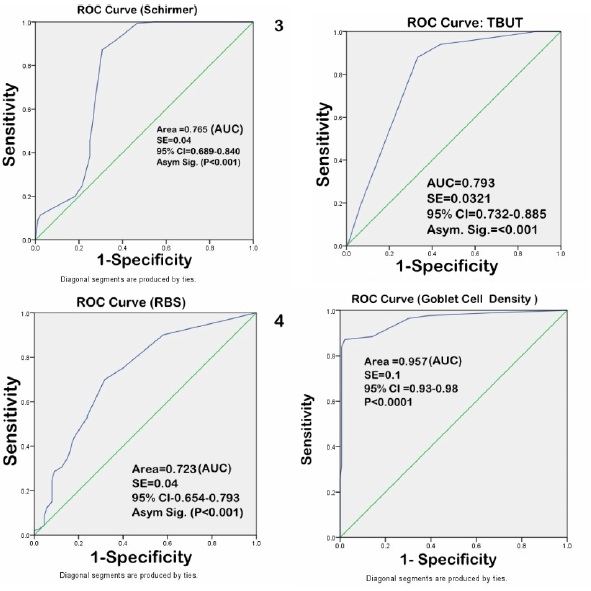
Figure 5 Sensitivity and specificity of tear film tests under Receiver operating characteristic (ROC) curve.
Discussion
The present study evaluated the diagnostic accuracy of Schirmer, TBUT, RBS and CIC and the extent to which there tests correlate with symptoms as compared to healthy controls.
Routine tear function tests like Schirmer, TBUT and RBS are commonly used by eye care professionals worldwide for evaluation of dry eye syndrome; these tests can be performed in all settings, are inexpensive and less time consuming than CIC. However, some of these tests are poorly standardized, lack well defined cut-off values, do not correlate well with dry eye symptoms, are inaccurate and unrepeatable making compare between studies tenuous at best [14,15]. Therefore, dry eye diagnosis per se has been a challenging task for clinicians. As a consequence, symptom based assessment has been a key component of clinical diagnosis in dry eye conditions; in dry eye research, a questionnaire can serve as a screening instrument and to define treatment groups according to symptoms [16]. The dry eye scoring system (DESS©), used in the present study, is a simple and effective tool for assessment of dry eye. CIC is a minimally-invasive technique of harvesting superficial layers of conjunctiva and cornea. Cells are removed by application of cellulose acetate filters or biopore membranes and subsequently analyzed by various methods depending on study objective or pathology involved. CIC can be used in conjunction with techniques like light microscopy, flow cytometry, RT-PCR amplification and immunohistochemistry, to aid in diagnosis and providing insight into mechanism and pathogenesis of dry eye disease [17]. However, CIC has still not become the first line diagnostic investigation for dry eye probably because it is not readily available in all settings.
Versura et al. evaluated diagnostic performance of tear function tests like Schirmer, TBUT, Jones test, tear clearance test, Lissamine green staining and CIC in Sjogren's syndrome patients (n=177). They evaluated sensitivity, specificity, likelihood ratio (LR+), receiver-operating characteristics (ROC) curves for each test. The results showed poor diagnostic performance of Schirmer and TBUT. On the contrary, Ocular surface disease index (OSDI) questionnaire and other tests exhibited a high diagnostic performance (AUC in the ROC analysis >0.70). CIC and Lissamine staining showed the highest sensitivity among the diagnostic tests performed in the population under study [18]. The results of the present study were comparable to this study.
In another study, Versura et al. evaluated the performance of tear osmolarity compared to Ocular Surface Disease Index (OSDI) symptoms questionnaire, Schirmer I test, TBUT, ferning test, lissamine green staining, tear clearance, corneal esthesiometry, and CIC by scraping and imprint. Tear film osmolarity showed a good performance in dry eye diagnosis, higher than the other tests considered, mainly in severe dry eye [19].
In a clinic based population, Sullivan et al retrospective evaluated eyes of 263 patients and 82 controls for relationship between common signs and symptoms of DED. The authors found lack of correlation between dry eye symptoms and tests like tear film osmolarity, TBUT, Schirmer and corneal staining. The authors concluded that symptoms alone are insufficient for the diagnosis and management of DED and argue for a consensus of clinical signs that better reflect all aspects of the disease [20]. Fuentes-Páez et al. also reported that there is lack of correlation between ocular symptoms and signs observed; patient may not be symptomatic despite abnormal tear function tests and not all symptomatic patients have abnormal tear function tests [21]. A dry eye patient may be severely symptomatic and still have Schirmer?s test reading greater than 10mm (insignificant correlation).
In the present study, out of 88% symptomatic cases, 53.6% had abnormal impression cytology; amongst these (48 % had Nelson grade 2 and 5.6% Nelson grade 3 changes, respectively); whereas amongst 23.7% symptomatic controls, only 6.1%% (Nelson grade 2 & 3) had abnormal cytology. Correlation analysis (with regression) suggests that there was a significant correlation of dry eye symptoms with Nelson grade (adjusted R2=0.774) (Figures 4). Thus, the main advantage of CIC may be predicting early changes in ocular surface in dry eye (undetected by routine tear function tests), so that appropriate intervention can be taken before metaplastic changes have taken place. One of the most important feature of dry syndrome is alteration of conjunctival and corneal epithelium as seen on vital staining (Rose Bengal and Lissamine green). However, these methods are less sensitive and specific, have low diagnostic accuracy, do not indicate degree of squamous metaplasia or changes in goblet cell density and do not correlate with disease severity [22]. Moreover, validity of vital stains in milder forms of dry eye is also questionable [23]. The results of the present study substantiate these findings as sensitivity, specificity and area under ROC curve of RBS in diagnosing dry eye in computer users was 34.6 %, 86%, and (AUC=0.723), respectively.
In a case control study, Kumar et al. found that with CIC as the gold standard, tear function tests like Schirmer?s, tear film break up time (TBUT) and ocular surface staining were less specific, sensitive and had a lower positive predictive value for diagnosing dry eye; this was further substantiated by the observation that there was a significant reduction in GCD in cases as compared to controls; an observation similar to the present study [8].
Messmer et al. measured tear film osmolarity with the Tear lab in 200 healthy individuals and patients with dry eye; a correlation analysis between tear osmolarity, dry eye symptoms, Schirmer, TBUT and ocular surface staining was performed. The authors did not find any correlation with the signs and symptoms of dry eye. Moreover, tear film osmolarity testing could not discriminate between patients with DES (308.9 ± 14.0 mosm/l) and the control group (307.1 ± 11.3 mosml/l) [23].
The shortcoming of the present study was that other tear film tests like tear meniscus height and tear film osmolarity were not compared due to unavailability of necessary equipment. In conclusion, the results of the present study suggest that tear film tests like Schirmer and RBS have low diagnostic accuracy and are less sensitive and specific than TBUT and CIC. Although CIC correlates best with dry eye symptoms and has very good specificity and sensitivity in diagnosis of dry eye, the equipment needed to carry out the testing may not be readily available in all settings.
Acknowledgements
The authors would like to thank Dr S.K. Sharma, Director, Rotary Eye Hospital, Palampur, HP, India, for technical advice.
References
- (2007) The definition and classification of dry eye disease: report of the Definition and Classification Subcommittee of the International Dry Eye Workshop. Ocul Surf 5: 75-92.
- Yoon KC, Jeong IY, Park YG, Yang SY (2007) Interleukin-6 and tumor necrosis factor-alpha levels in tears of patients with dry eye syndrome. Cornea 26: 431-437.
- Narayanan S, Miller WL, McDermott AM (2006) Conjunctival cytokine expression in symptomatic moderate dry eye subjects. Invest Ophthalmol Vis Sci 47: 2445-2450.
- Bhargava R, Kumar P, Kumar M, Mehra N, Mishra A (2013) A randomized controlled trial of omega-3 fatty acids in dry eye syndrome. Int J Ophthalmol 6: 811-816.
- Bhargava R, Kumar P, Kaur A, Kumar M, Mishra A (2014) The diagnostic value and accuracy of conjunctival impression cytology, dry eye symptomatology, and routine tear function tests in computer users. J Lab Physicians 6: 102-108.
- Bhargava R, Kumar P (2015) Evaluation of Dry Eye in patients with Psoriasis. J ocular Biol 3: 7.
- Nichols KK, Nichols JJ, Mitchell GL (2004) The lack of association between signs and symptoms in patients with dry eye disease. Cornea 23: 762-770.
- Kumar P, Bhargava R, Kumar M, Ranjan S, Kumar M, et al. (2014) The correlation of routine tear function tests and conjunctival impression cytology in dry eye syndrome. Korean J Ophthalmol 28: 122-129.
- Kumar P, Bhargava R, Kumar M (2013) Dry Eye Syndrome: A diagnostic enigma. International Journal of Contemporary Surgery 1: 72-77.
- Bhargava R, Kumar P, Phogat H, Kaur A, Kumar M (2015) Oral omega-3 fatty acids treatment in computer vision syndrome related dry eye. Cont Lens Anterior Eye S1367-0484: 00009-0.
- van Bijsterveld OP (1969) Diagnostic tests in the Sicca syndrome. Arch Ophthalmol 82: 10-14.
- Bhargava R, Kumar P (2015) Oral omega-3 Fatty Acid treatment for dry eye in contact lens wearers. Cornea 34: 413-420.
- Nelson JD, Havener VR, Cameron JD (1983) Cellulose acetate impressions of the ocular surface. Dry eye states. Arch Ophthalmol 101: 1869-1872.
- Nichols KK, Mitchell GL, Zadnik K (2004) The repeatability of clinical measurements of dry eye. Cornea 23: 272-285.
- Savini G, Prabhawasat P, Kojima T, Grueterich M, Espana E, et al. (2008) The challenge of dry eye diagnosis. Clin Ophthalmol 2: 31-55.
- Begley CG, Caffery B, Chalmers RL, Mitchell GL, Dry Eye Investigation (DREI) Study Group (2002) Use of the dry eye questionnaire to measure symptoms of ocular irritation in patients with aqueous tear deficient dry eye. Cornea 21: 664-670.
- Brignole-Baudouin F, Ott AC, Warnet JM, Baudouin C (2004) Flow cytometry in conjunctival impression cytology: a new tool for exploring ocular surface pathologies. Exp Eye Res 78: 473-481.
- Versura P, Frigato M, Cellini M, Mulè R, Malavolta N, et al. (2007) Diagnostic performance of tear function tests in Sjogren's syndrome patients. Eye (Lond) 21: 229-237.
- Versura P, Profazio V, Campos EC (2010) Performance of tear osmolarity compared to previous diagnostic tests for dry eye diseases. Curr Eye Res 35: 553-564.
- Sullivan BD, Crews LA, Messmer EM, Foulks GN, Nichols KK, et al. (2014) Correlations between commonly used objective signs and symptoms for the diagnosis of dry eye disease: clinical implications. Acta Ophthalmol 92: 161-166.
- Fuentes-Páez G, Herreras JM, Cordero Y, Almaraz A, González MJ, et al. (2011) Lack of concordance between dry eye syndrome questionnaires and diagnostic tests. Arch Soc Esp Oftalmol 86: 3-7.
- Korb DR, Herman JP, Finnemore VM, Exford JM, Blackie CA (2008) An evaluation of the efficacy of fluorescein, rose bengal, lissamine green, and a new dye mixture for ocular surface staining. Eye Contact Lens 34: 61-64.
- Machado LM, Castro RS, Fontes BM (2009) Staining patterns in dry eye syndrome: rose Bengal versus lissamine green. Cornea 28: 732-734.
- Messmer EM, Bulgen M, Kampik A (2010) Hyperosmolarity of the tear film in dry eye syndrome. Dev Ophthalmol 45: 129-138.